
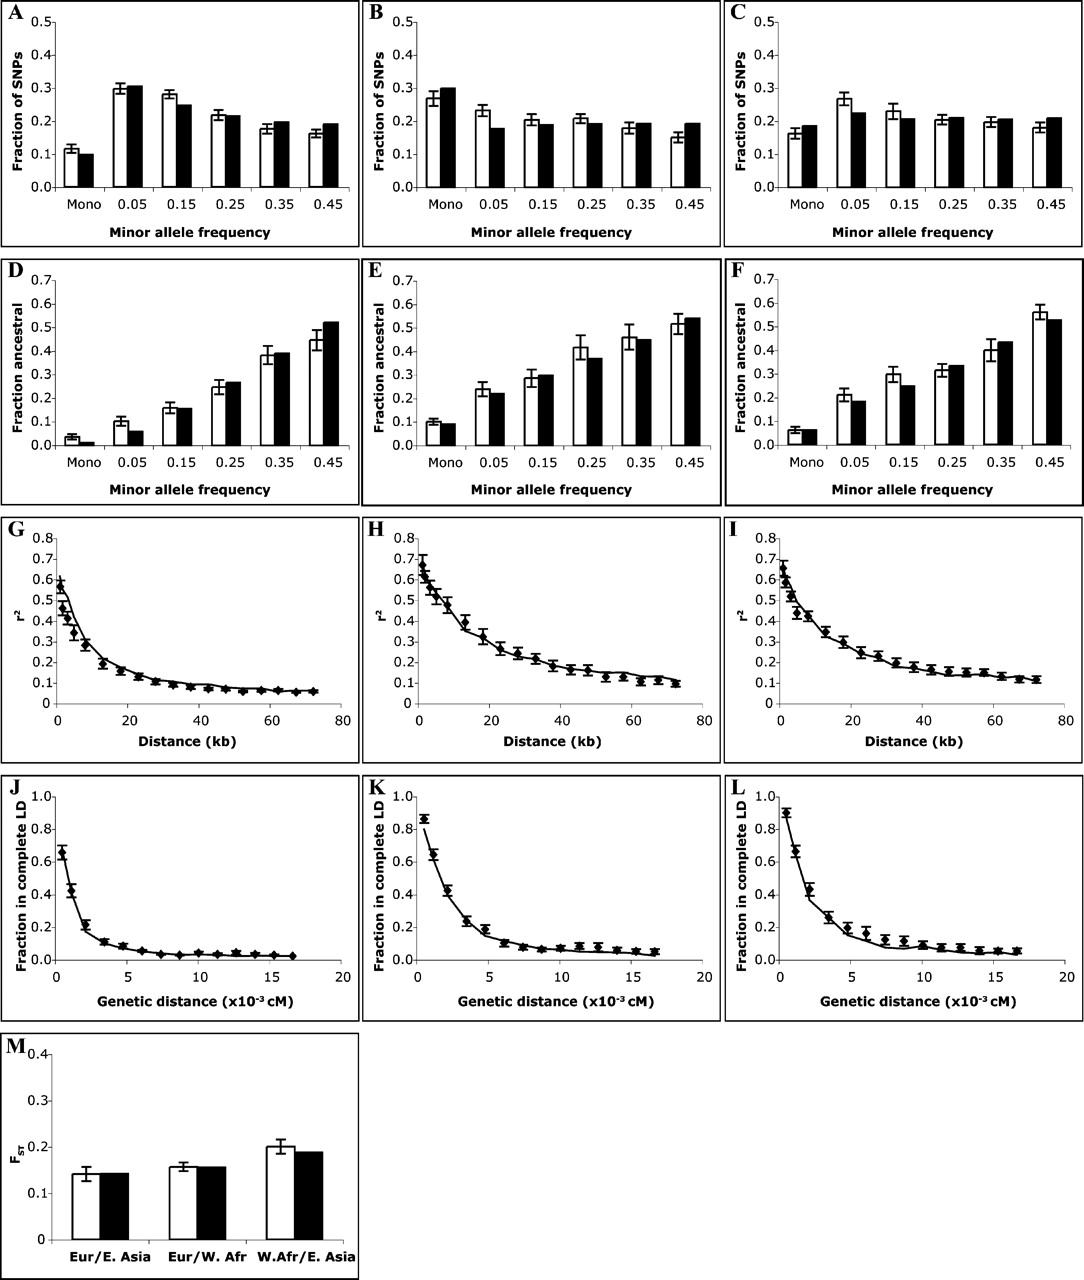
Figure 2.
Comparison of best-fit model with empirical data, autosomes. Error bars represent one standard error. (A,B,C) Allele frequency spectrum. (White) Data; (black) model. (A) West African. (B) East Asian. (C) European sample. (D,E,F) Fraction of alleles that are ancestral/chimpanzee, binned by allele frequency. (White) Data; (black) model. (D) West African. (E) East Asian. (F) European. (G,H,I) Linkage disequilibrium (r2) versus physical distance. (Points) Data; (line) model. (G) West African. (H) East Asian. (I) European. (J,K,L) Fraction of marker pairs with perfect LD (D′ = 1.0) versus genetic distance. (J) West African. (K) East Asian. (L) European. (M) Genetic distance (FST). (White) Data; (black) model.


