
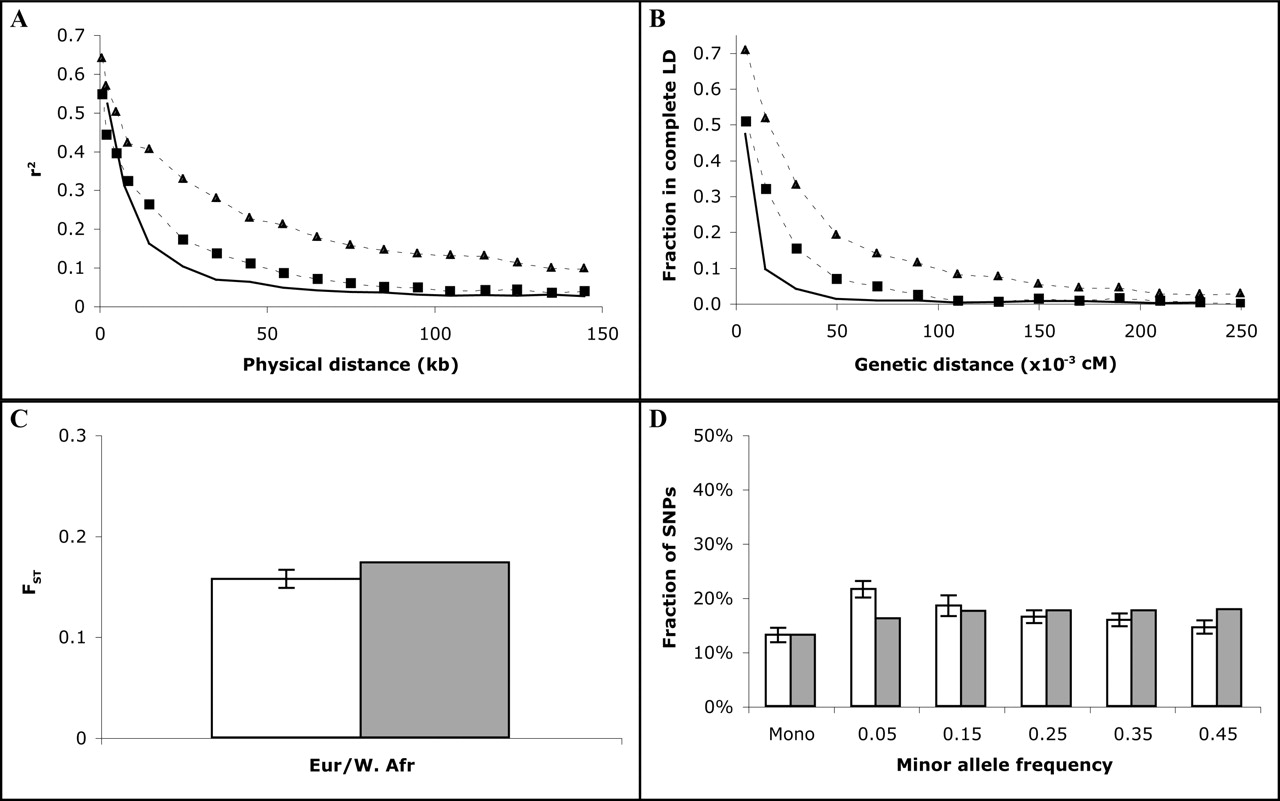
Figure 1.
Fit of standard neutral model to empirical data. Comparison of simulated data under standard neutral model to empirical data on autosomes. Error bars represent one standard error. (A,B) Linkage disequilibrium (measured by r2 and D′) as a function of distance. (Solid line) Standard neutral model; (squares) West African data; (triangles) European data. (A) r2 as a function of physical distance. (B) D′ as a function of genetic distance. (C,D) Genetic distance (FST) and allele frequency spectrum for data and standard neutral model. (White) Data; (gray) model. (C) FST between European and West African populations. (D) European allele frequency spectrum.


