
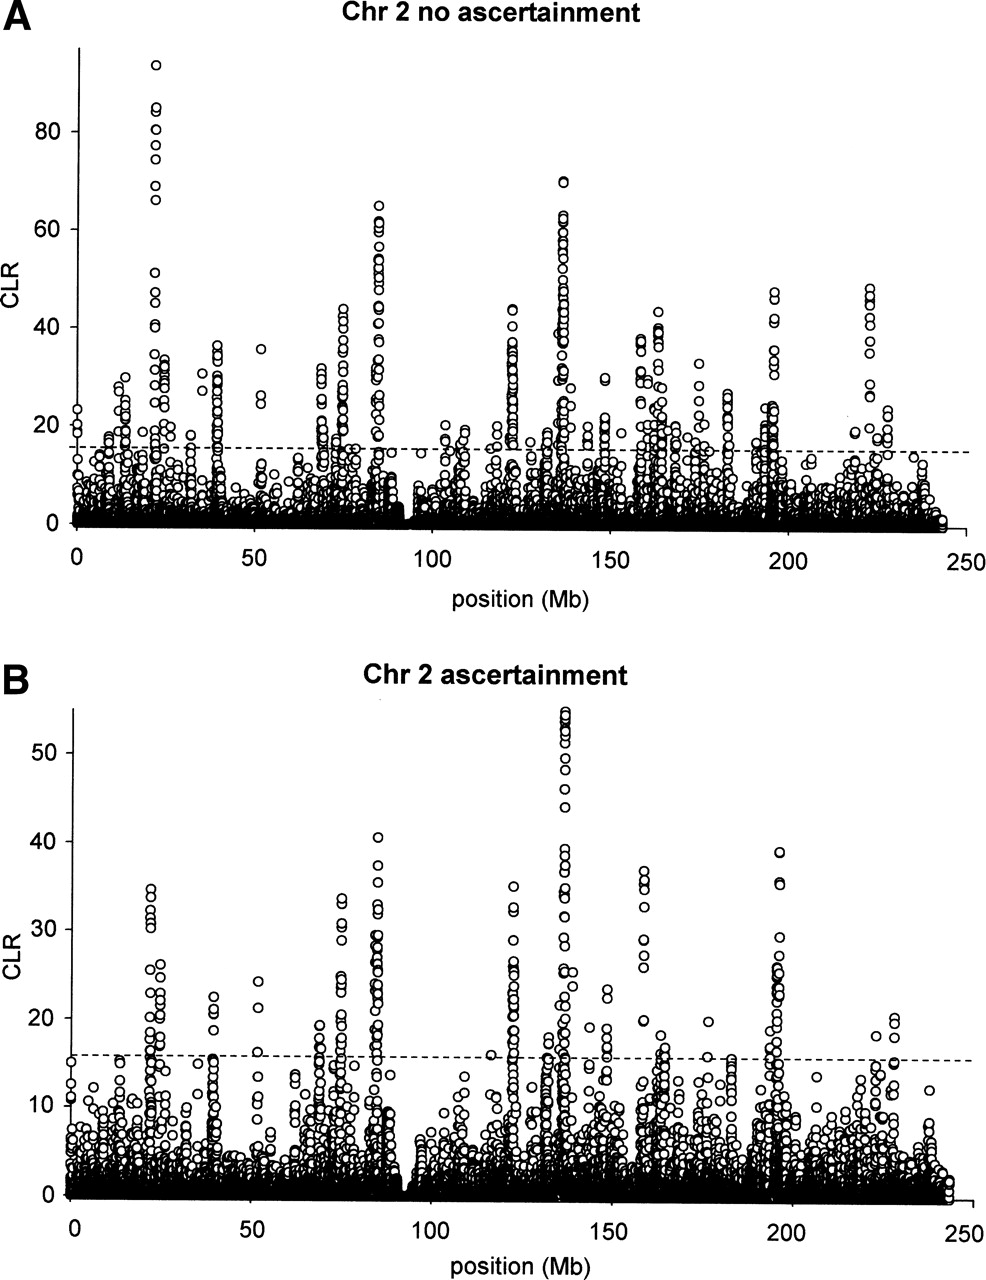
Figure 9.
The maximized composite likelihood surface calculated for data from Chromosome 2 from the HapMap project (The International HapMap Consortium 2003). The dotted line indicates the 5% cutoff value as determined by simulations under a standard neutral equilibrium model. Results are shown with (B) and without (A) a correction for ascertainment bias.


