
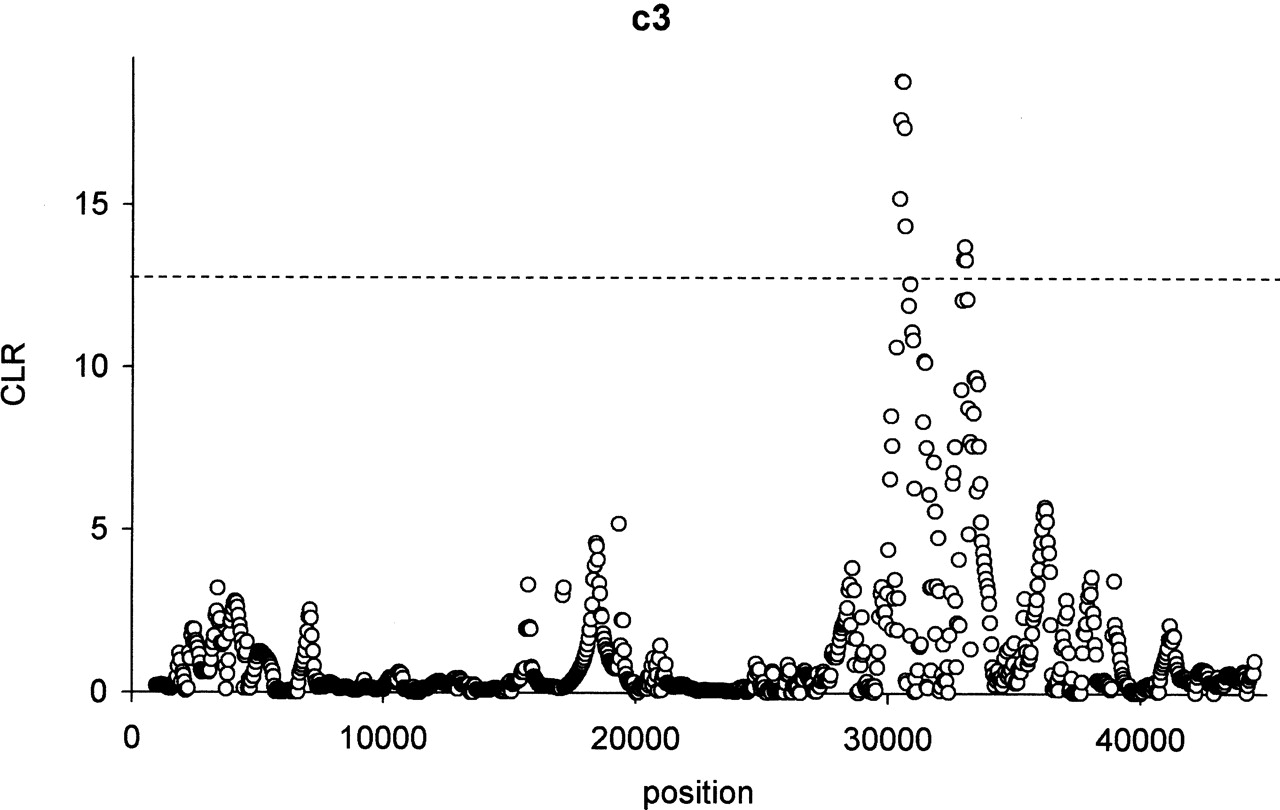
Figure 8.
The maximized composite likelihood surface calculated for the c3 gene calculated from the Seattle SNP database (SeattleSNPs, http://pga.gs.washington.edu [Feb. 2004]). The dotted line indicates the 5% cutoff value as determined by simulations under a standard neutral equilibrium model.


