
Figure 7.
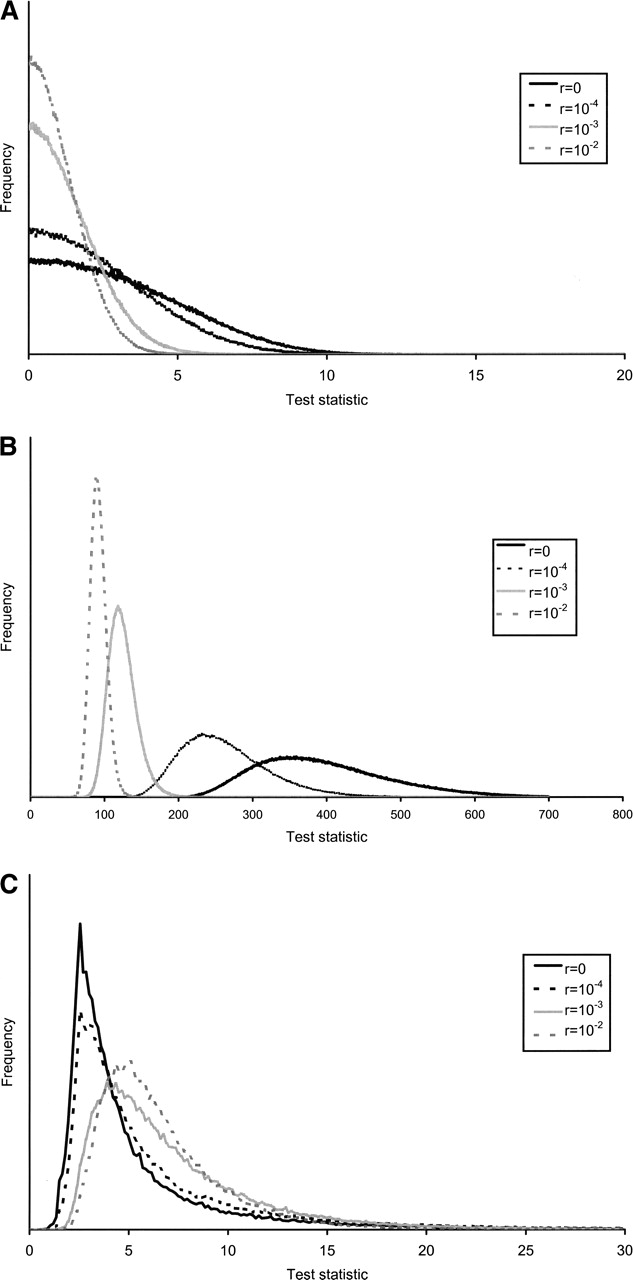
The null distribution of (A) the Mann-Whitney U (MWU) test, (B) Test 1, and (C) Test 2 under varying assumptions regarding the recombination rate.
(Downloading may take up to 30 seconds. If the slide opens in your browser, select File -> Save As to save it.)
Click on image to view larger version.
The null distribution of (A) the Mann-Whitney U (MWU) test, (B) Test 1, and (C) Test 2 under varying assumptions regarding the recombination rate.
 CiteULike
 Delicious
 Digg
Digg Facebook
 Google+
 Reddit
 Twitter
