
Figure 6.
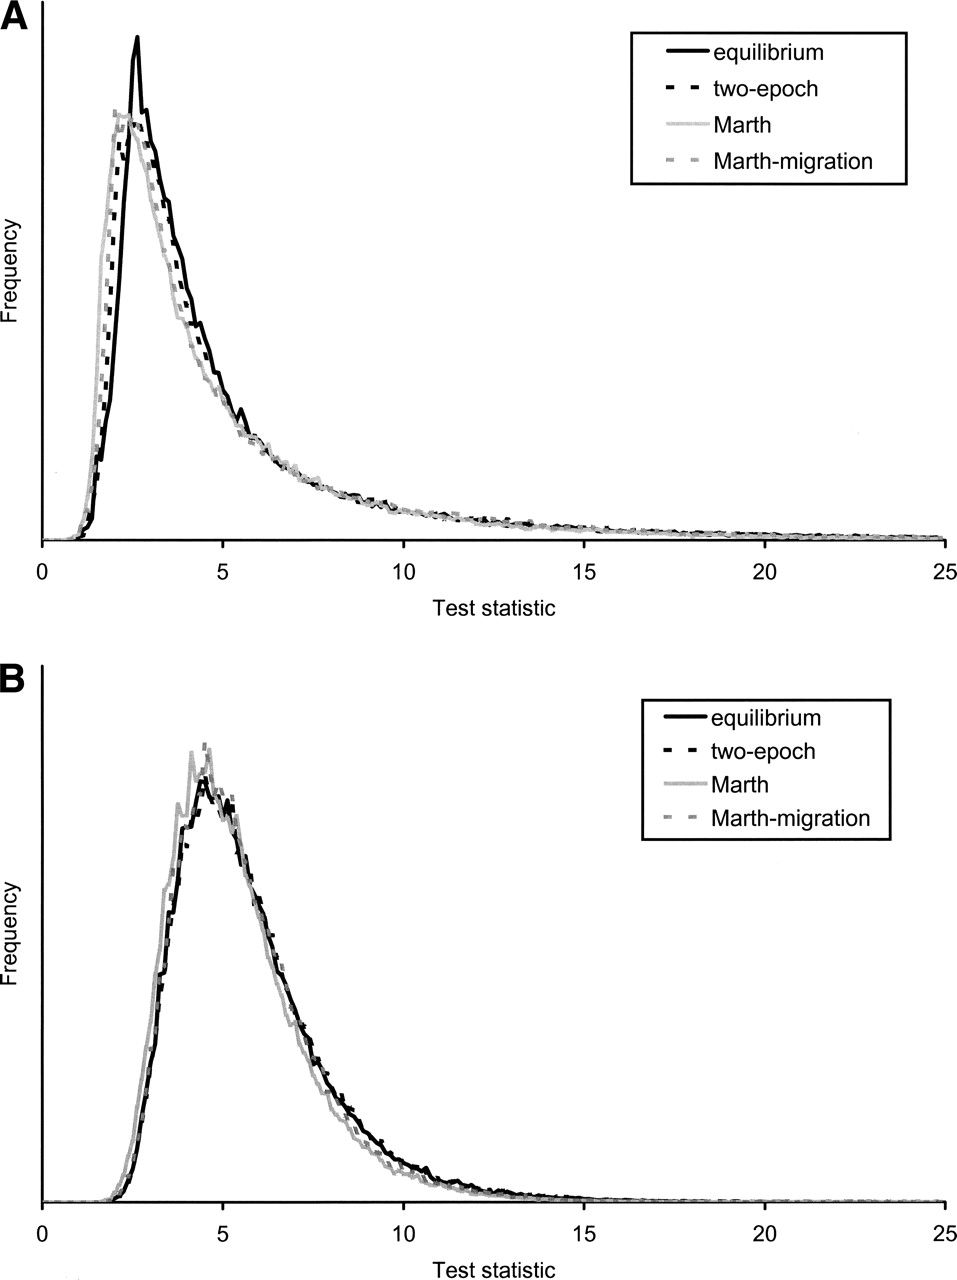
The null distribution of Test 2 different tests under different demographic models described in the text and a recombination rate of (A) 2NR = 0 and (B) 2NR =10–3 per base pair.
(Downloading may take up to 30 seconds. If the slide opens in your browser, select File -> Save As to save it.)
Click on image to view larger version.
The null distribution of Test 2 different tests under different demographic models described in the text and a recombination rate of (A) 2NR = 0 and (B) 2NR =10–3 per base pair.
 CiteULike
 Delicious
 Digg
Digg Facebook
 Google+
 Reddit
 Twitter
