
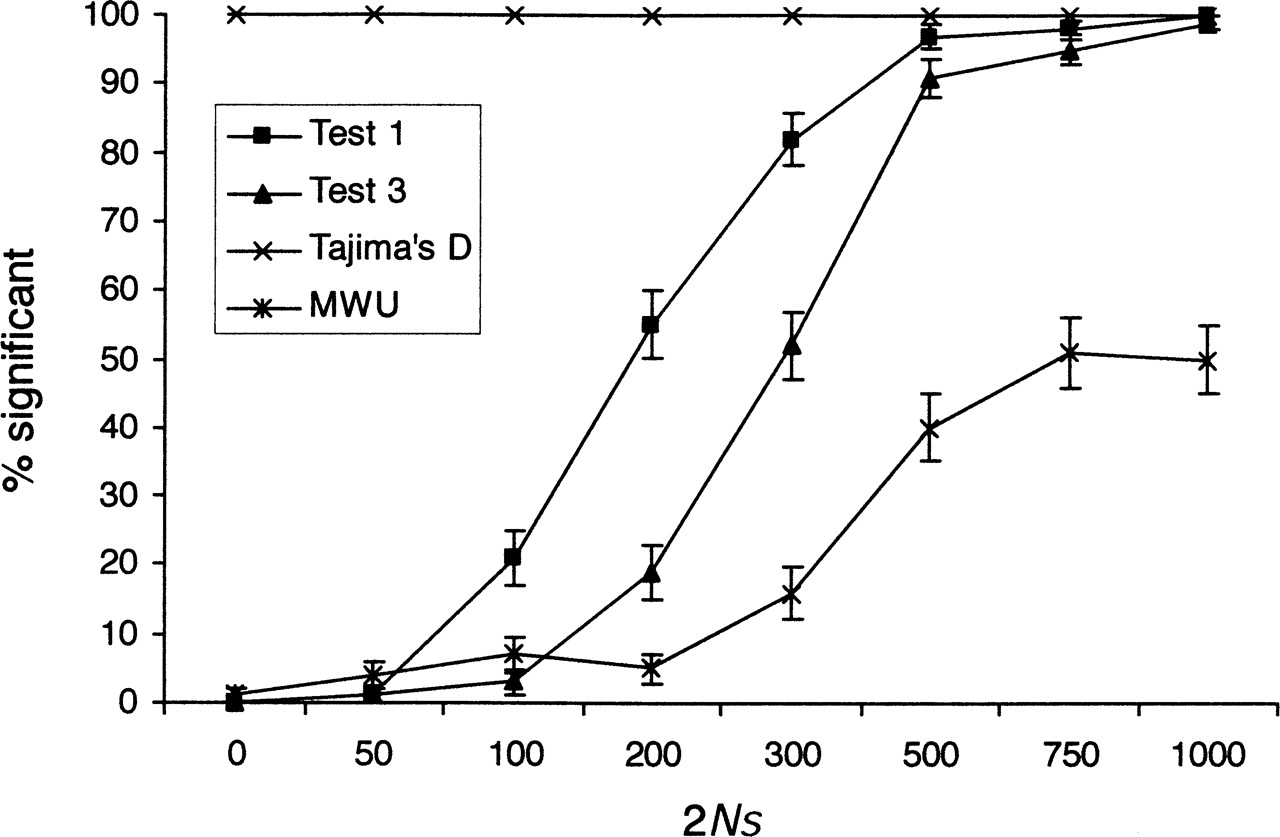
Figure 3.
The proportion of significant results of the four different tests under population growth, when an equilibrium model is used as the null model. The simulation details are as in Figure 1, but with a 10-fold reduction in population size N generations ago. The null model assumed is a standard neutral equilibrium model without population growth.


