
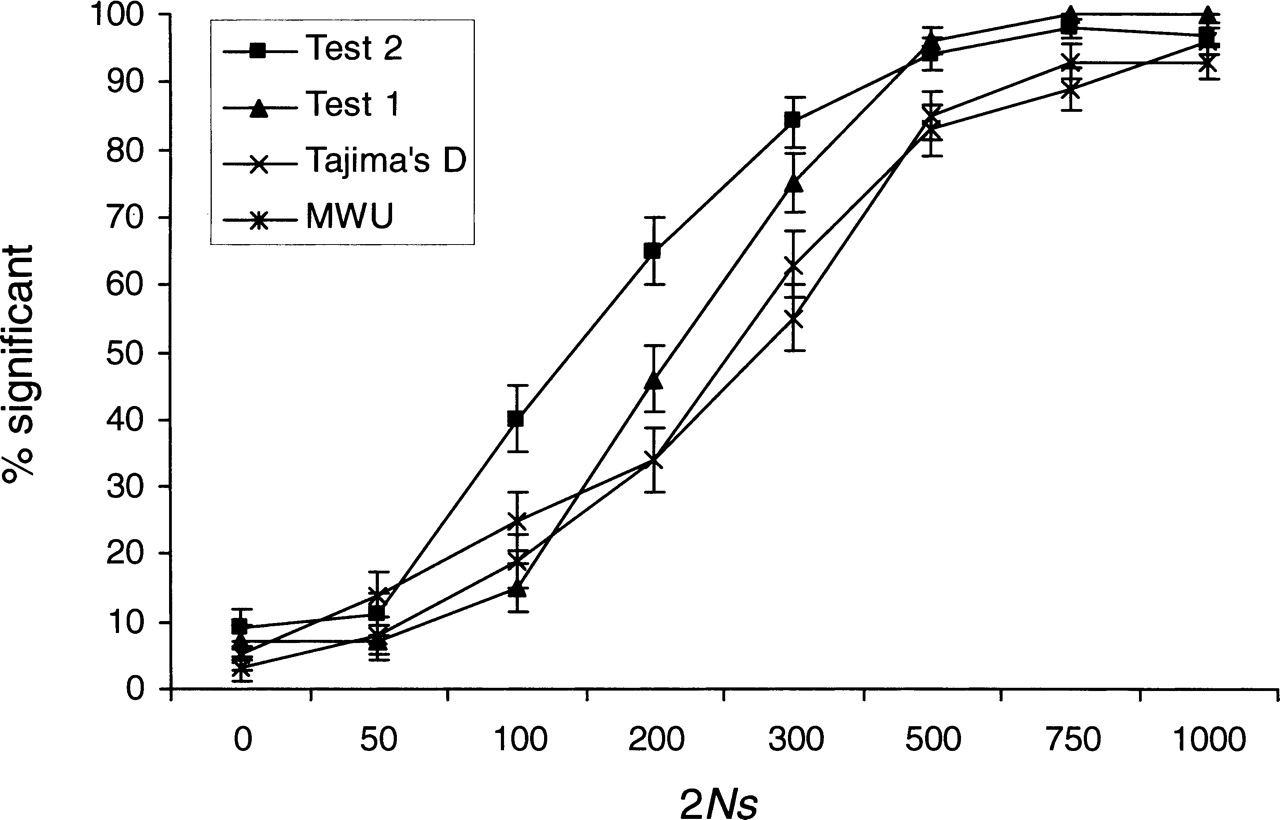
Figure 2.
The proportion of significant results of the four different tests when applied to the folded frequency spectrum (see Fig. 1 for other details).
(Downloading may take up to 30 seconds. If the slide opens in your browser, select File -> Save As to save it.)
Click on image to view larger version.
The proportion of significant results of the four different tests when applied to the folded frequency spectrum (see Fig. 1 for other details).
 CiteULike
 Delicious
 Digg
Digg Facebook
 Google+
 Reddit
 Twitter
