
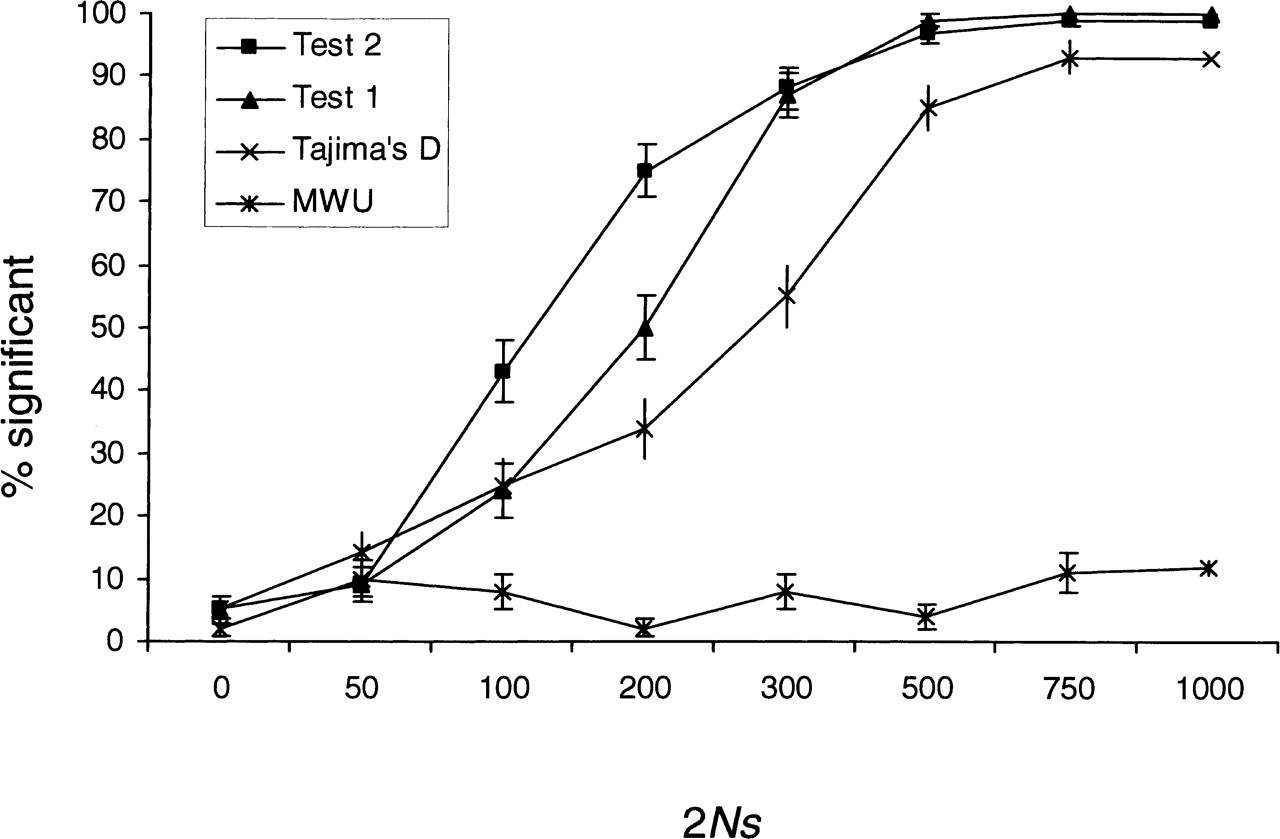
Figure 1.
The proportion of significant results of the four different tests when applied to the unfolded frequency spectrum, as determined by simulations, assuming a region of 250 kb and a single selective sweep. The power is given as a function of the product of the chromosomal population size (2N) and the selection coefficient (s). Error bars indicate ±1 standard deviation. Each point is calculated using 100 replicate simulations.


