
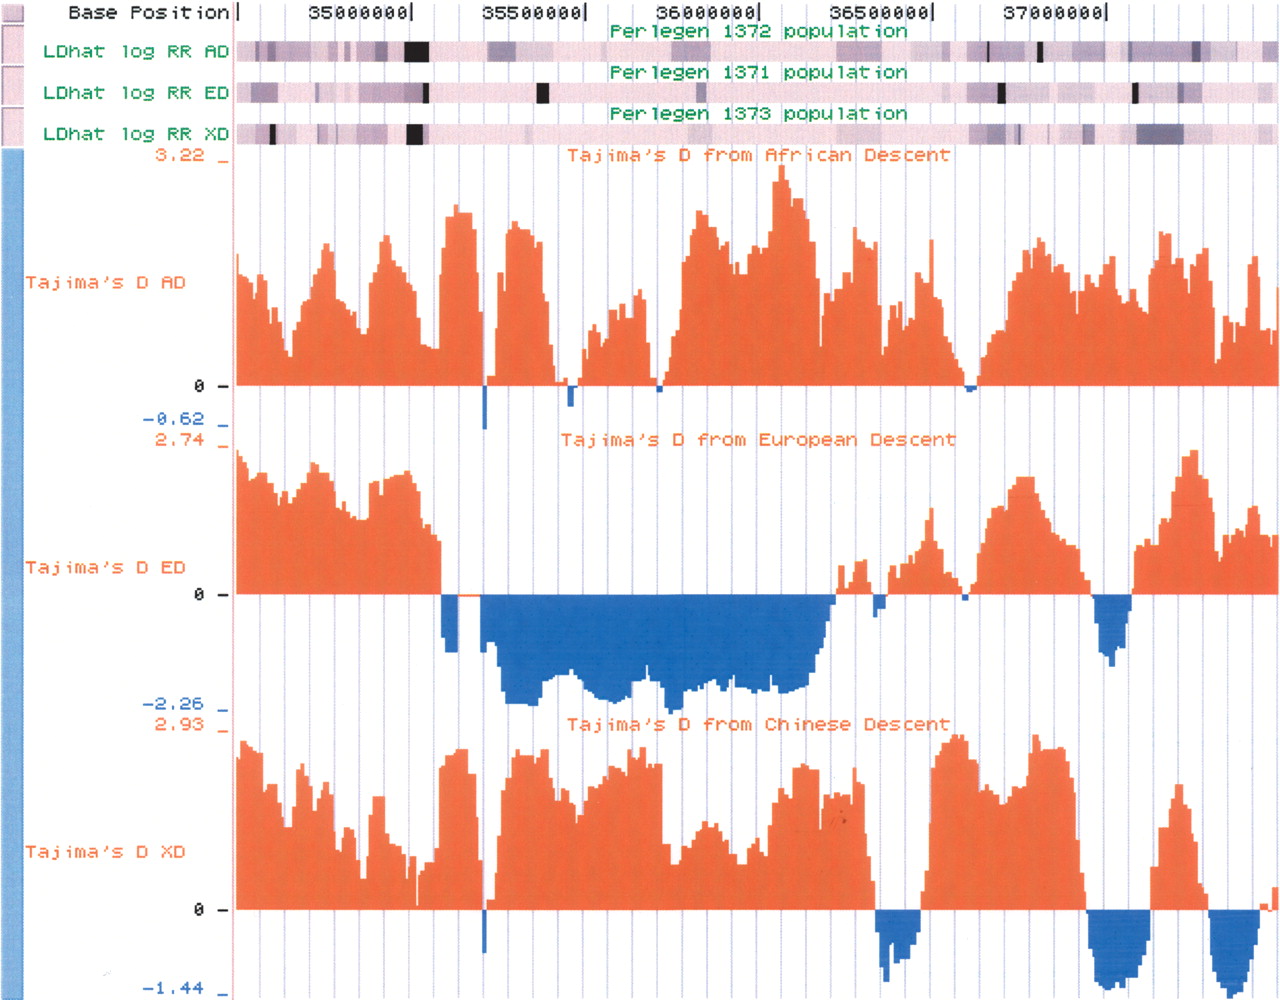
A close-up of the CLSPN CRTR from the UCSC genome browser is shown, with the Tajima's D tracks as well as a set of tracks showing the inferred relative recombination rate from LDhat for each population in grayscale (track label, LDhat log RR AD/ED/XD): Darker segments correspond to high inferred recombination rates. CLSPN is located at 35.9 Mbp. The left edge of the CLSPN CRTR (at ∼35 Mbp in the ED population) corresponds to a strong recombination hotspot observed in all three populations, but of greater interest are the hotspots spanned by the CRTR at ∼35.4 Mbp and ∼35.8 Mbp. Thus, although this CRTR does span a region with reduced recombination overall, there are several inferred hotspots within the CRTR that are shared between populations.


