
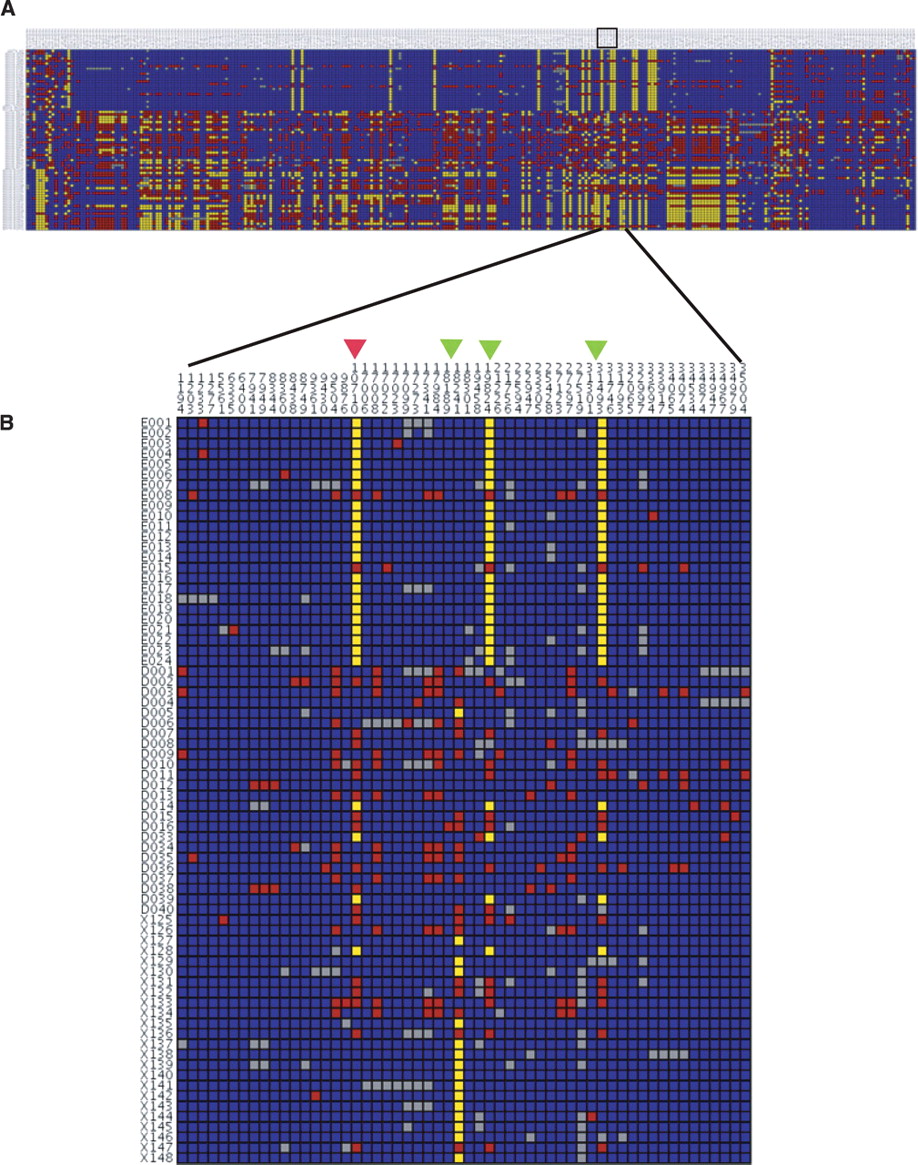
(A) A visual genotype for 1.5 Mbp spanning the CLSPN CRTR in the Perlegen data. Each row corresponds to an individual, and each column corresponds to a polymorphic site, with genotypes color coded as follows: Common allele homozygotes are shown in blue, heterozygotes are shown in red, rare allele homozygotes are shown in yellow, and missing data are shown as gray. The top 24 samples are ED, the middle 23 samples are AD, and the bottom 24 samples are XD. Although nucleotide diversity is depressed across a large region, there is no clear minimum within the CRTR. Nucleotide diversity was relatively constant across the region, so CLSPN (shown as a black box) was selected as a target for resequencing because of interesting patterns of Fst between ED and XD, in addition to low nucleotide diversity. (B) A visual genotype of the resequencing results for the CLSPN gene. The top 24 samples are ED; the middle 24 samples are AD, and the bottom 24 samples are XD. As expected, a number of polymorphisms nearly fixated between ED and XD were observed. One of these SNPs (10710, red arrowhead) changes an amino acid (Ser525Asn), whereas the other three are intronic (green arrowheads).


