
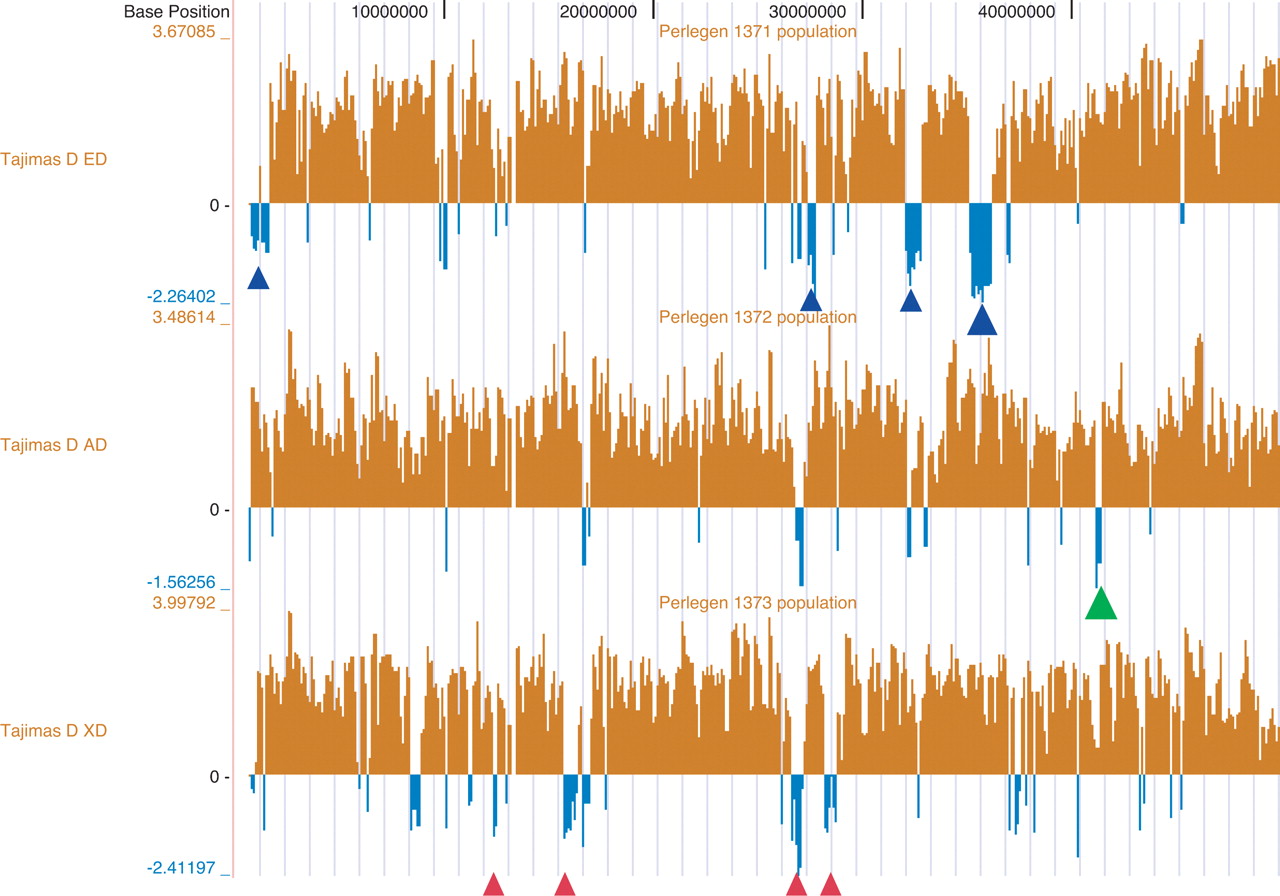
Figure 3.
Tajima's D in 100-kbp sliding windows with 10-kbp steps is shown across the first 50 megabases of chromosome 1. Several CRTRs are visible, including a region near 35M in the ED population containing CLSPN (large blue arrowhead) and a region near 41M in the AD population spanning CTPS, FLJ23878, and SCMH1 (large green arrowhead). CRTRs at the less stringent 5% level are also indicated in the ED population as small blue arrowheads and in the XD population as small red arrowheads.


