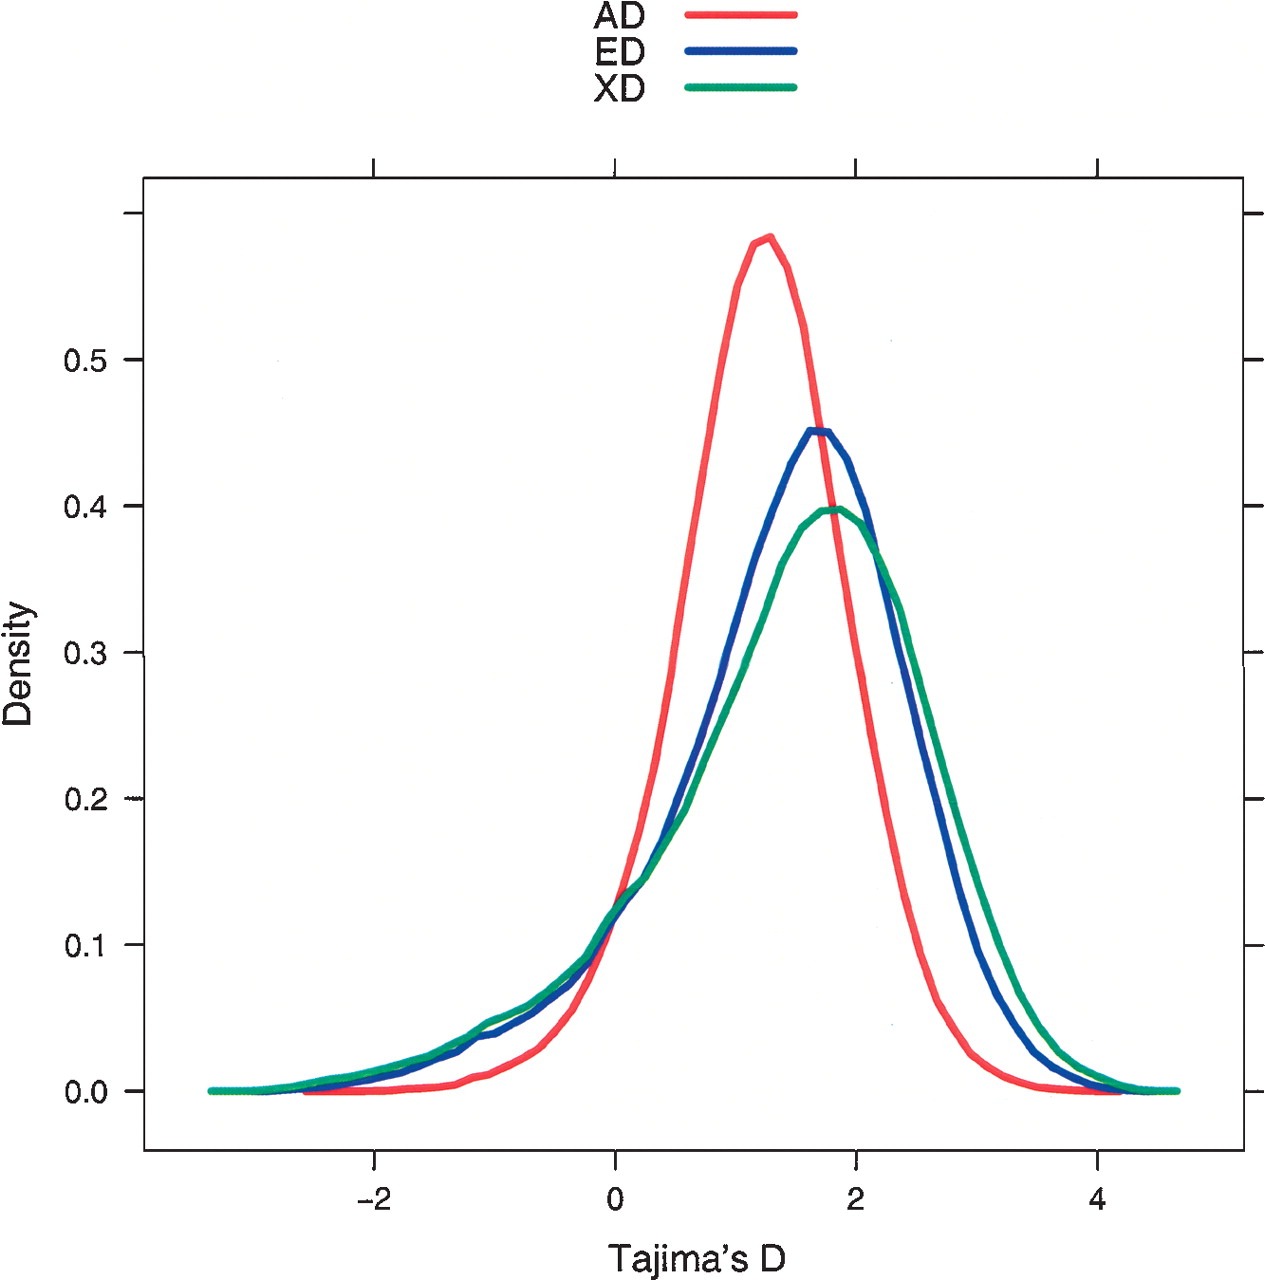
Genomic regions exhibiting positive selection identified from dense genotype data

(Downloading may take up to 30 seconds. If the slide opens in your browser, select File -> Save As to save it.)

Click on image to view larger version.

Figure 2.
Figure 2.

A probability density plot of the distribution of Tajima's D in the sliding windows is shown for each population. All three distributions depart significantly from a normal distribution, most noticeably in the heavy tail at low values in each population.

This Article

  1. Genome Res. 15: 1553-1565

Preprint Server