
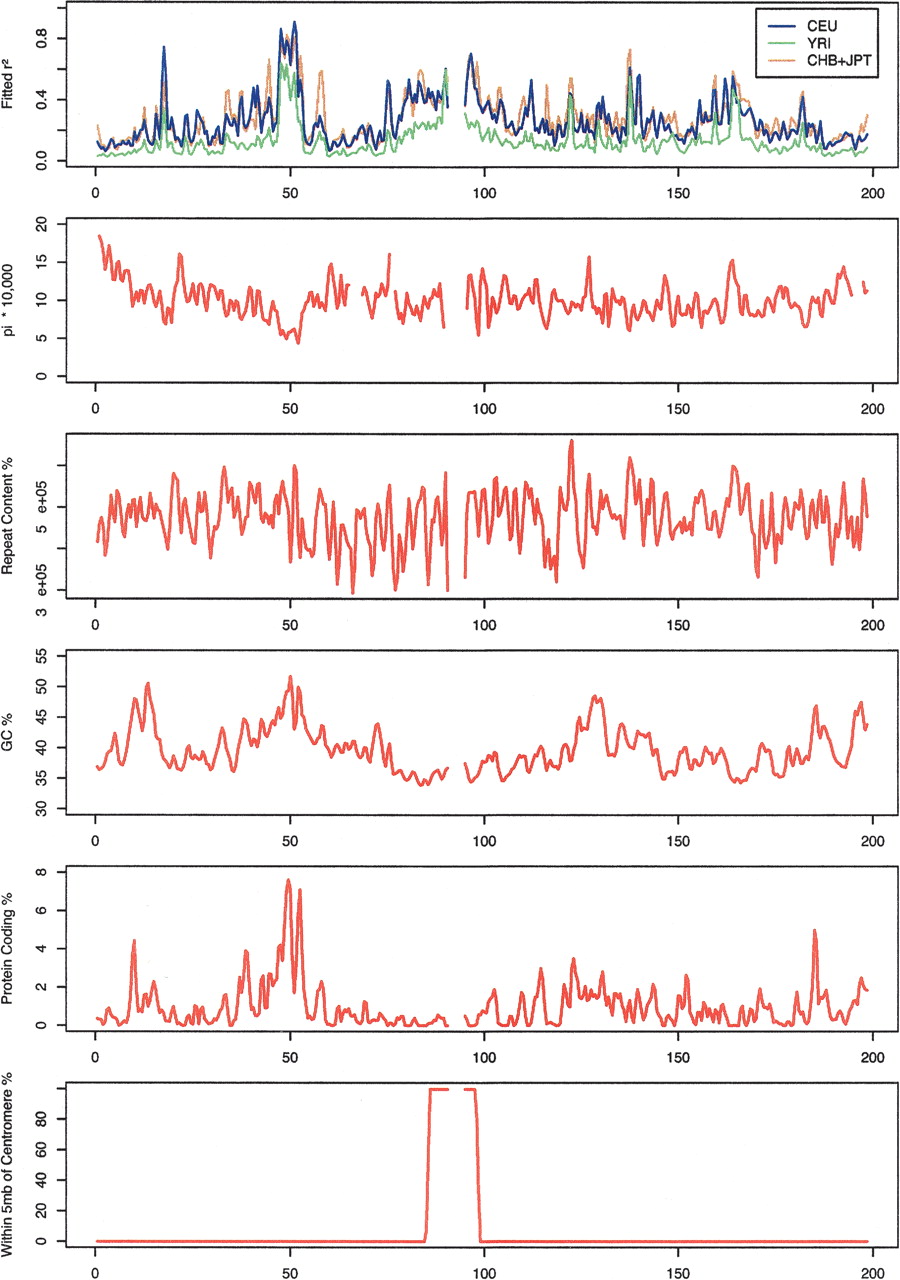
Figure 5.
Variation of fitted linkage disequilibrium values (for markers separated by 30,000 bp) across the three groups of samples and of selected sequence features including sequence polymorphism, total repeat content, GC content, proportion of coding bases, and proximity to the centromeres. Results refer to 1000-kb windows across chromosome 3.


