
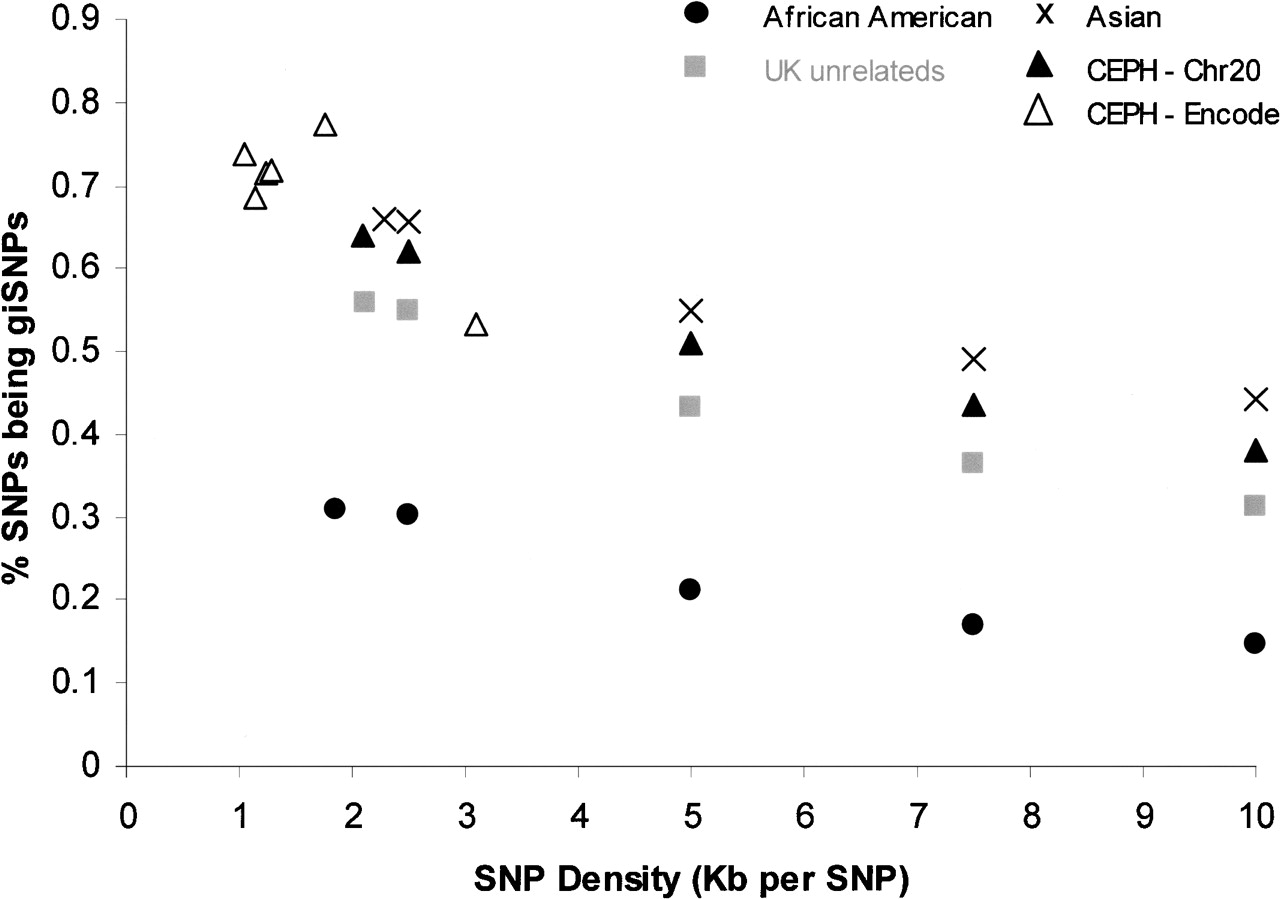
Figure 6.
Percentage of giSNPs observed at varying SNP densities using data from Encode (chromosomes 2, 4, and 7) and chromosome 20 (Sanger). Encode only contained data for CEPH families and is represented by hollow triangles (▵); all other data points are from the chromosome 20 study. Plots are shown for each sample using all available data points from a maximum density of one SNP per kilobase (Encode region 4) to a minimum density of one SNP per 10 kb (Chromosome 20). Percentage of giSNPs at 2.5, 5, 7.5, and 10 kb densities were calculated from randomly selected SNPs that were present in all four population samples.


