
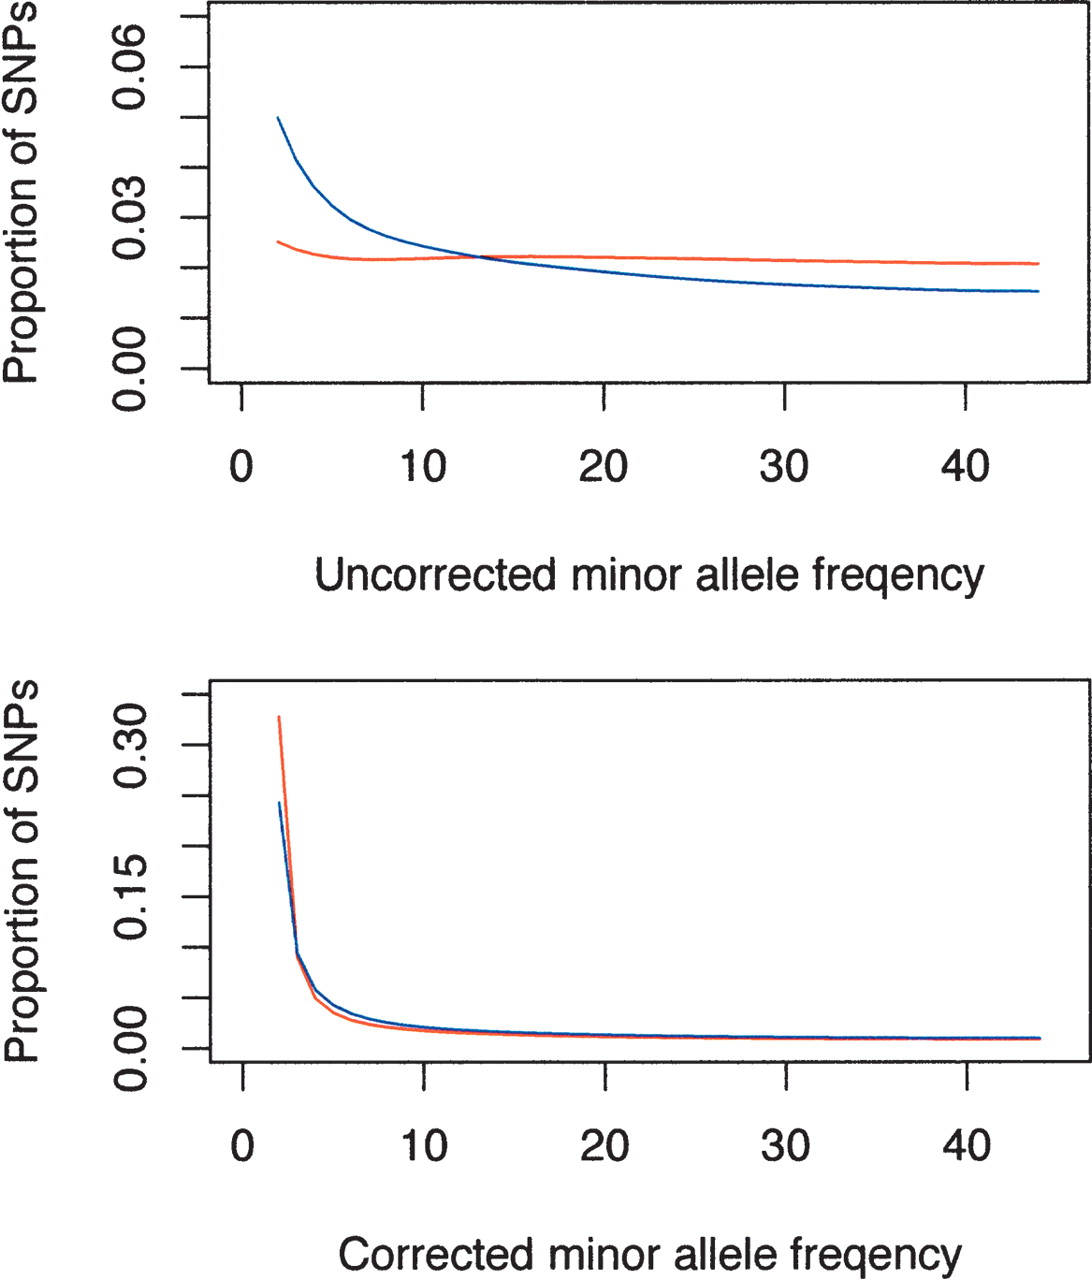
Figure 6.
Uncorrected (top) and ascertainment-corrected site frequency spectra (bottom) for the HapMap data (red)and the Perlegen data (blue dashed line). The HapMap data seriously underrepresented the rare SNPs compared with Perlegen, and the ascertainment correction produced frequency spectra that were more similar (bottom).


