
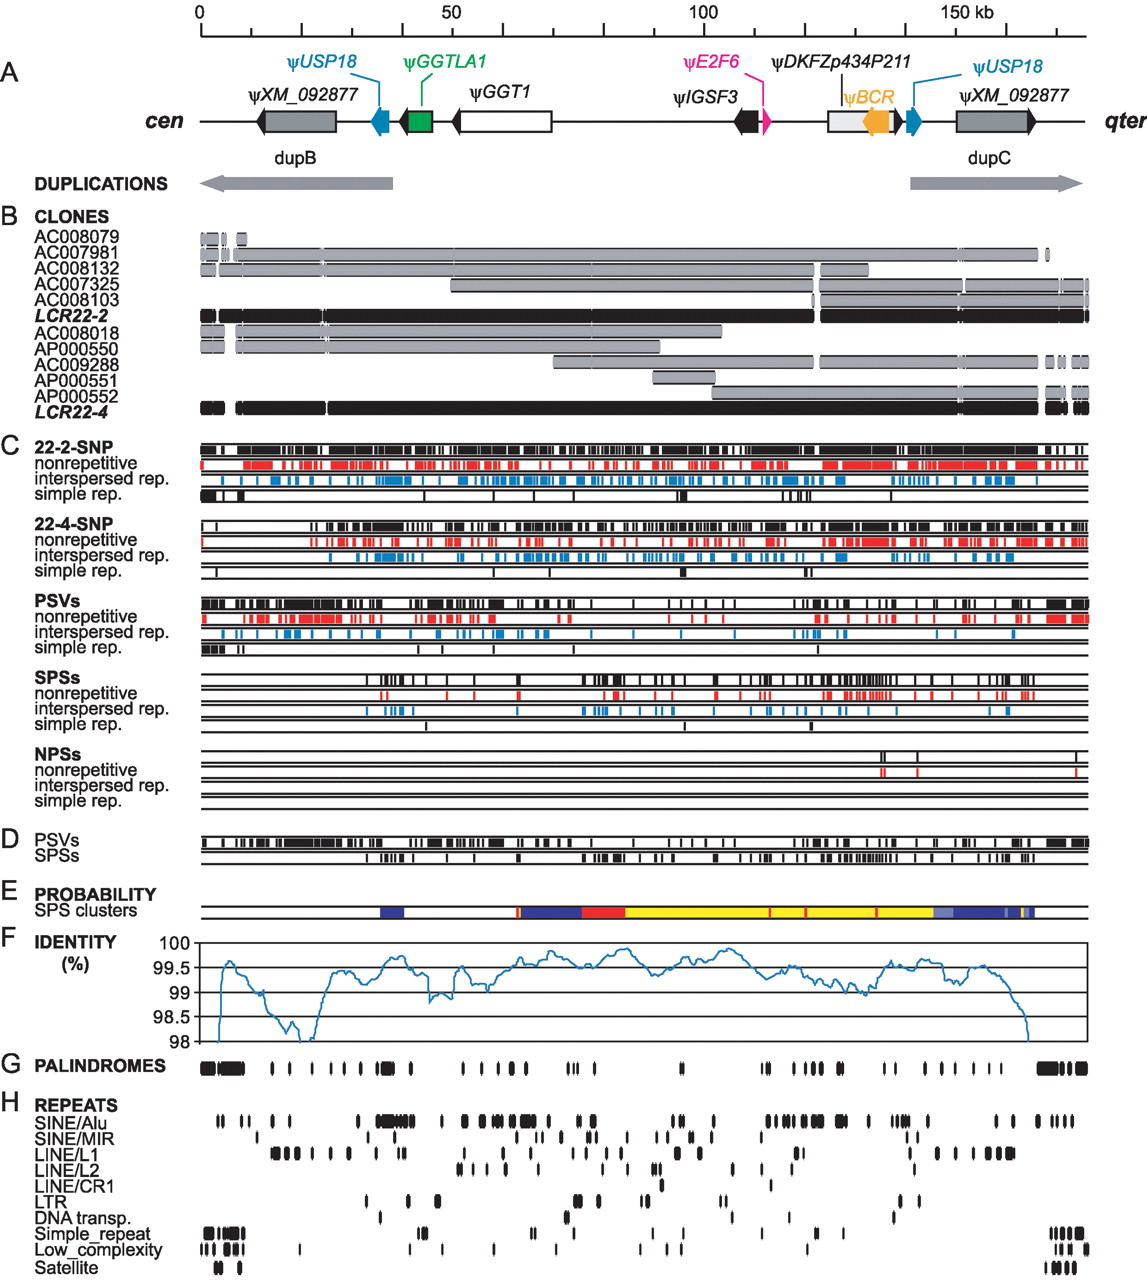
Polymorphism between LCR22-2 and LCR22-4. (A) Schematic organization of LCR22-2/LCR22-4 (see Fig. 1). (B) Clone coverage. The scheme shows positions of clones (gray) on the genomic sequences (black). (C) Distribution of polymorphic positions. Individual categories of polymorphic positions (see the text and Fig. 3) are shown as total (black, top), nonrepetitive (unique, red), those in interspersed repeats (blue), and simple repeats (black, bottom). (D) Unequal distribution of PSVs and SPSs. Positions located in simple repeats were removed. (E) Probability of SPS clusters. Nonrandom clusters of SPSs were defined by a binomial model (see Methods). Dark blue segments are clusters of SPSs with probability ≤0.05, light blue marks ≤0.01, yellow ≤1e-03, and red highlight clusters with probability ≤1e-05. (F) Nucleotide identity between genomic sequences. The plot was obtained using 5-kb sliding windows and step 500 bp. (G) Positions of long palindromes. (H) Distribution of groups of repetitive elements.


