
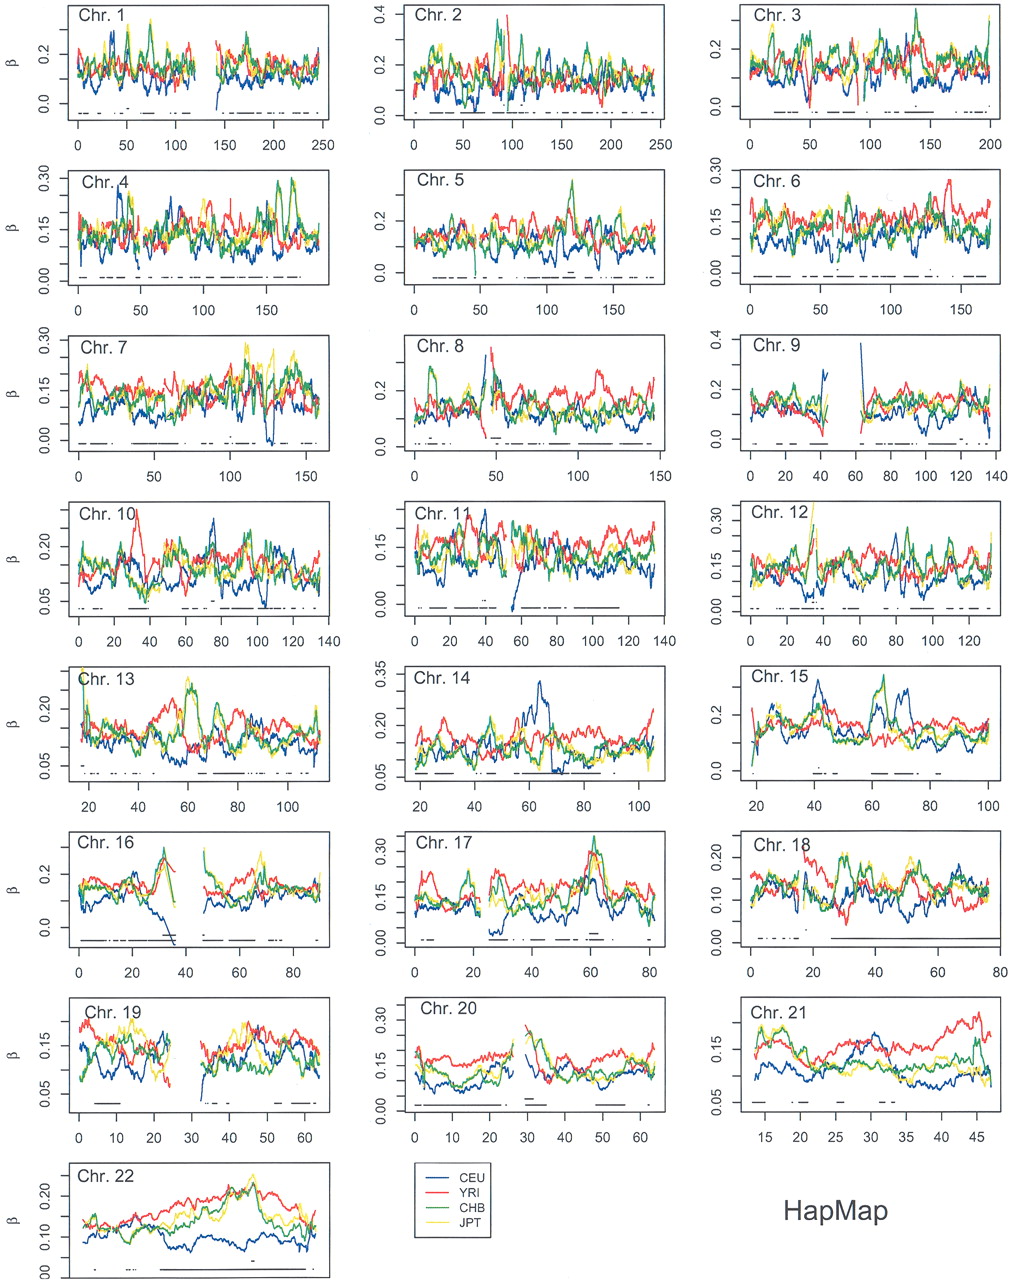
Figure 4.
HapMap 5-Mb window population-specific FST values. (Lower broken line) Regions where the greatest difference between population-specific values was more than three standard deviations, (upper broken line) regions where population-average values were more than three standard deviations from the mean.


