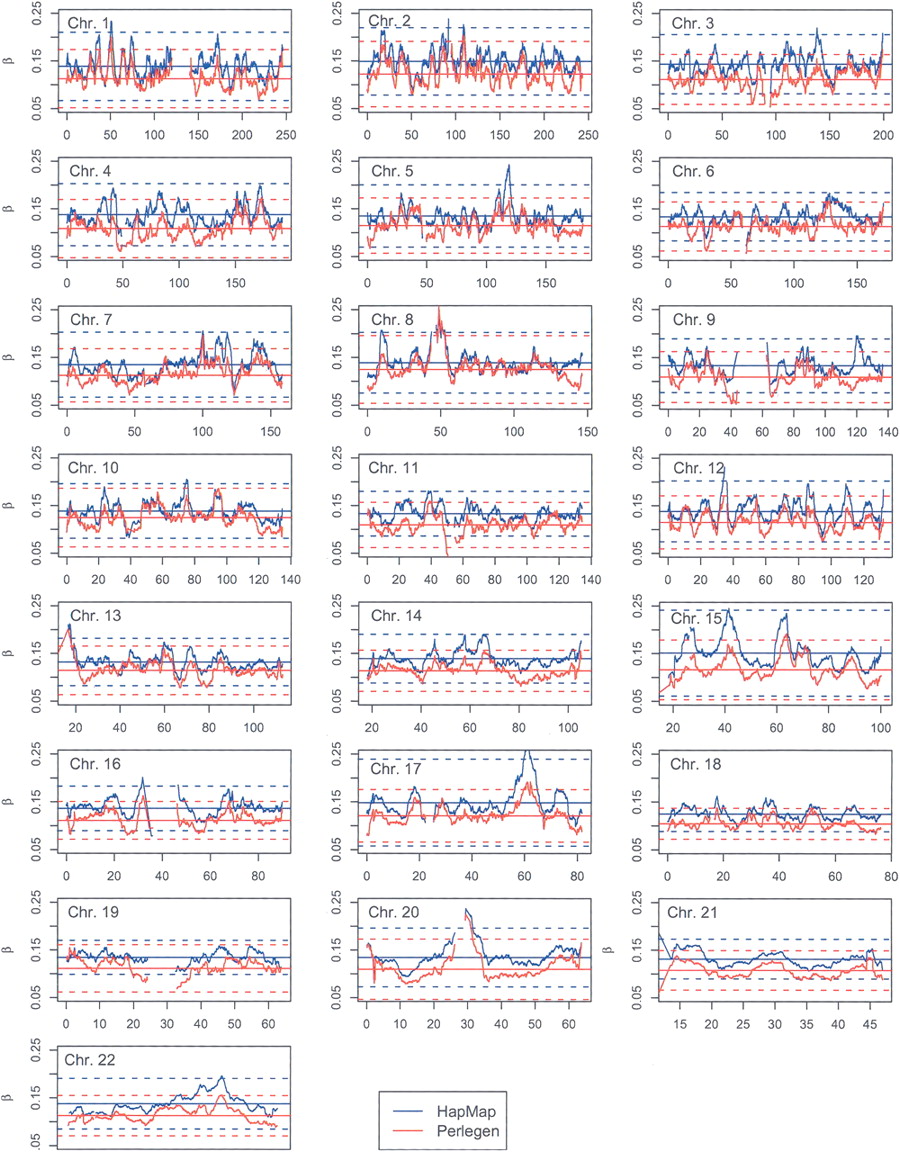
Measures of human population structure show heterogeneity among genomic regions

(Downloading may take up to 30 seconds. If the slide opens in your browser, select File -> Save As to save it.)

Click on image to view larger version.

Figure 3.
Figure 3.

5-Mb window population-average FST values for HapMap (blue) and Perlegen (red) samples. (Horizontal solid lines) Chromosome mean values, (horizontal dotted lines) the chromosome means plus or minus three standard deviations.

This Article

  1. Genome Res. 15: 1468-1476

Preprint Server