
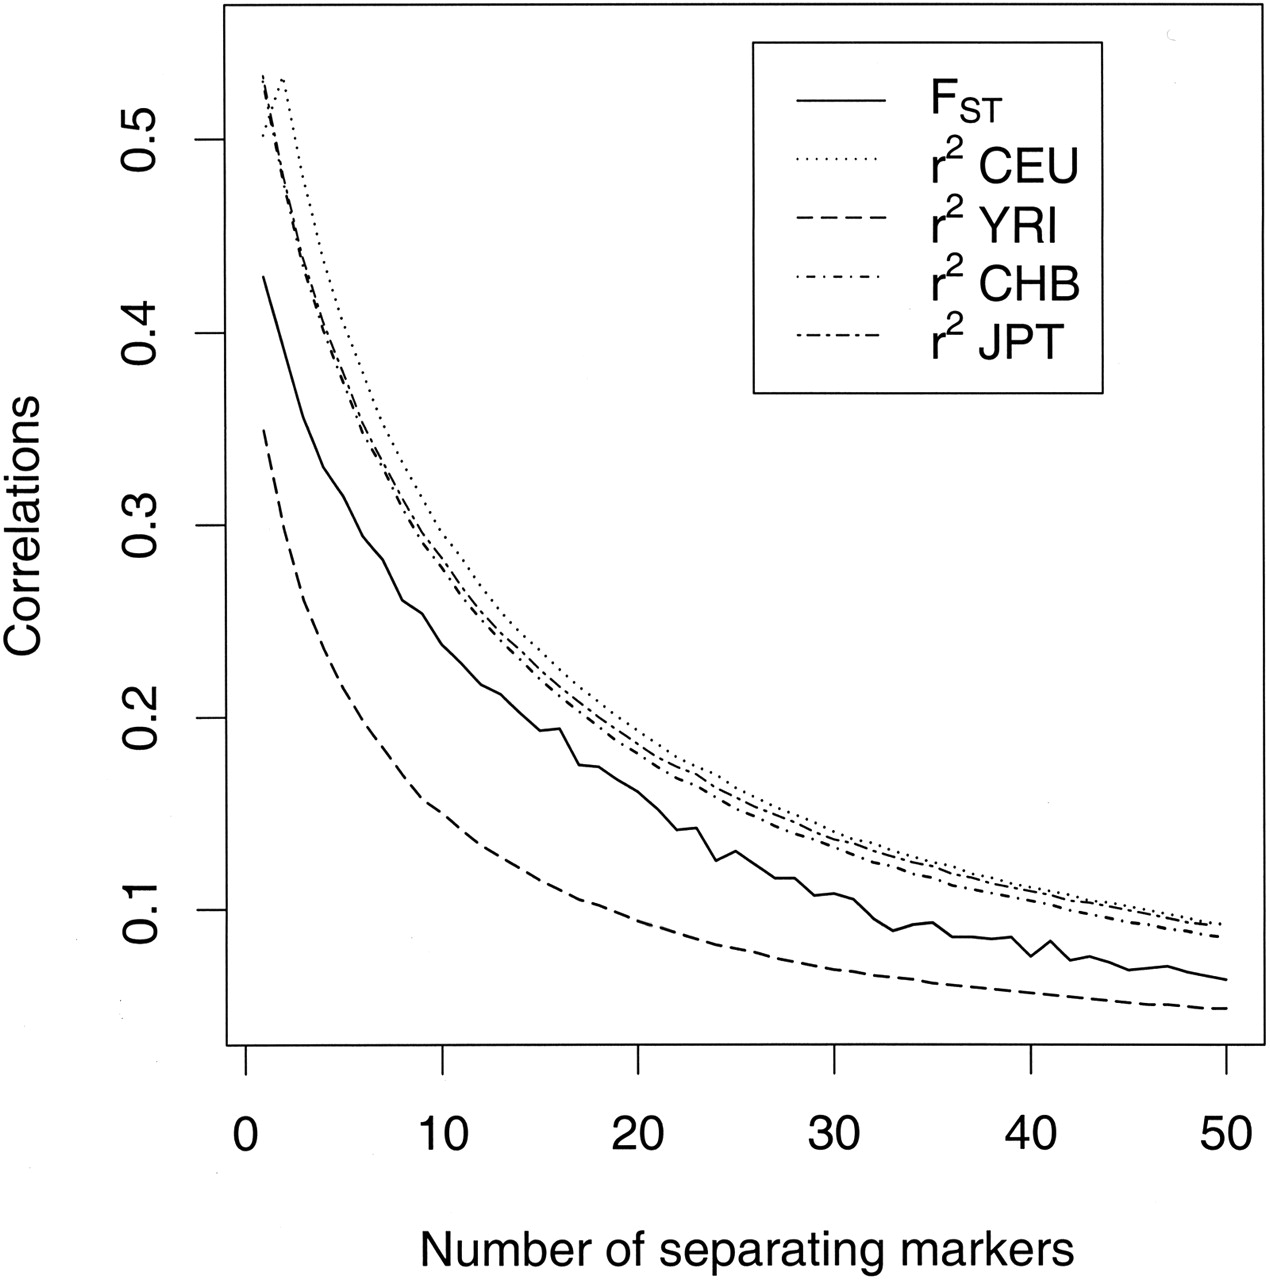
Figure 2.
Correlations for all pairs of markers on chromosome 2 in the HapMap data. Each correlation is calculated for pairs of markers separated by a fixed number of markers (1 to 50). The FST correlations are between the population-average FST values calculated separately for each marker in the pair. The r2 values (i.e., squared correlations) are for each pair of markers in each of the four HapMap samples.


