
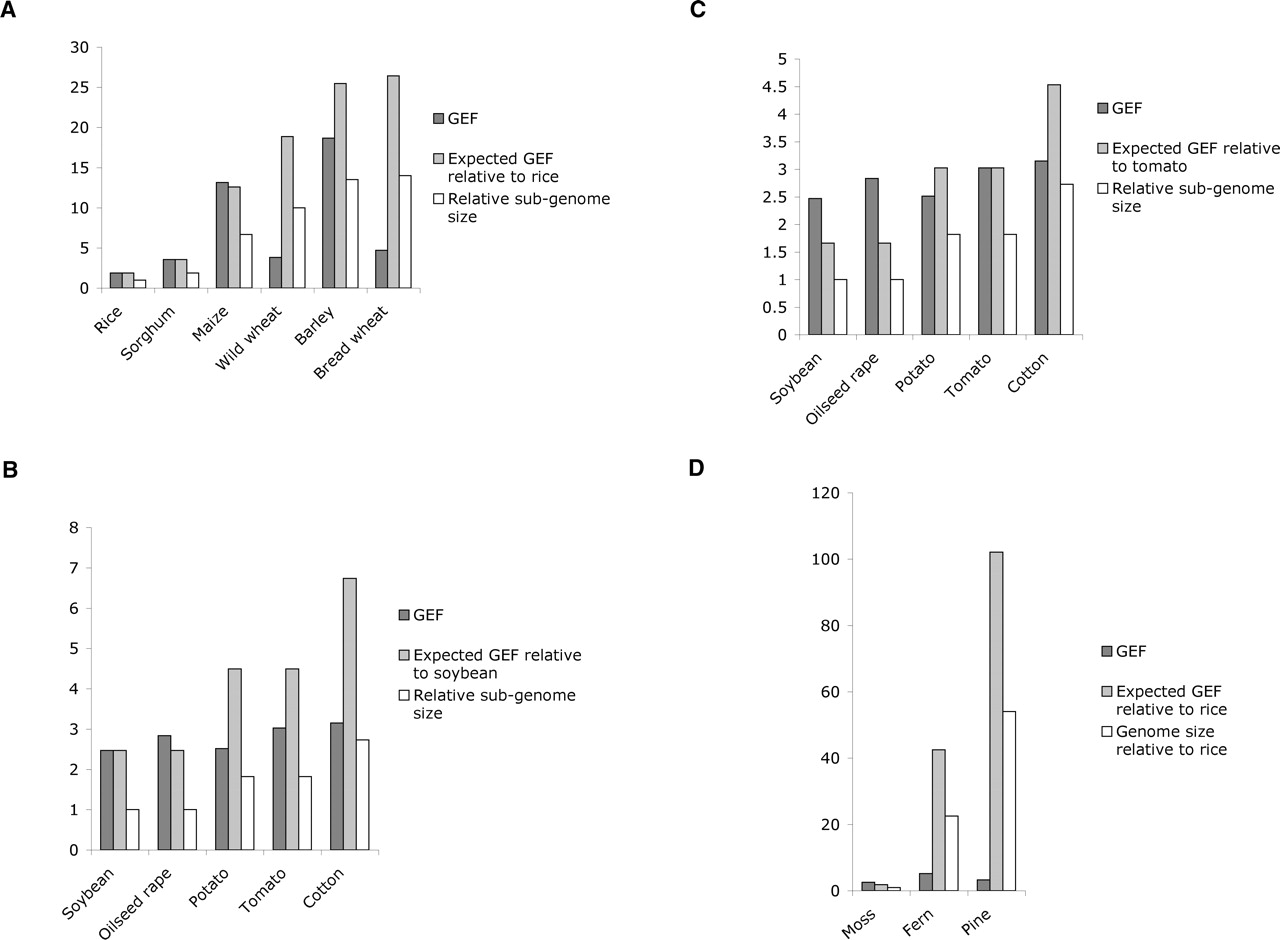
Figure 3.
Gene enrichment for each species. (A) Monocots. The expected GEF is calculated by extrapolation of the gene frequency found in rice to a genome of the corresponding size. (B) Dicots. The expected GEF is calculated by extrapolation of the gene frequency found in soybean to a genome of the corresponding size. (C) Same as B using tomato as a reference. (D) Non-angiosperms. The expected GEF is calculated by extrapolation of the gene frequency found in rice to a genome of the corresponding size. The GEF values are listed in Supplemental Table 1, and a list of all gene matches is shown in Supplemental Table 2.


