
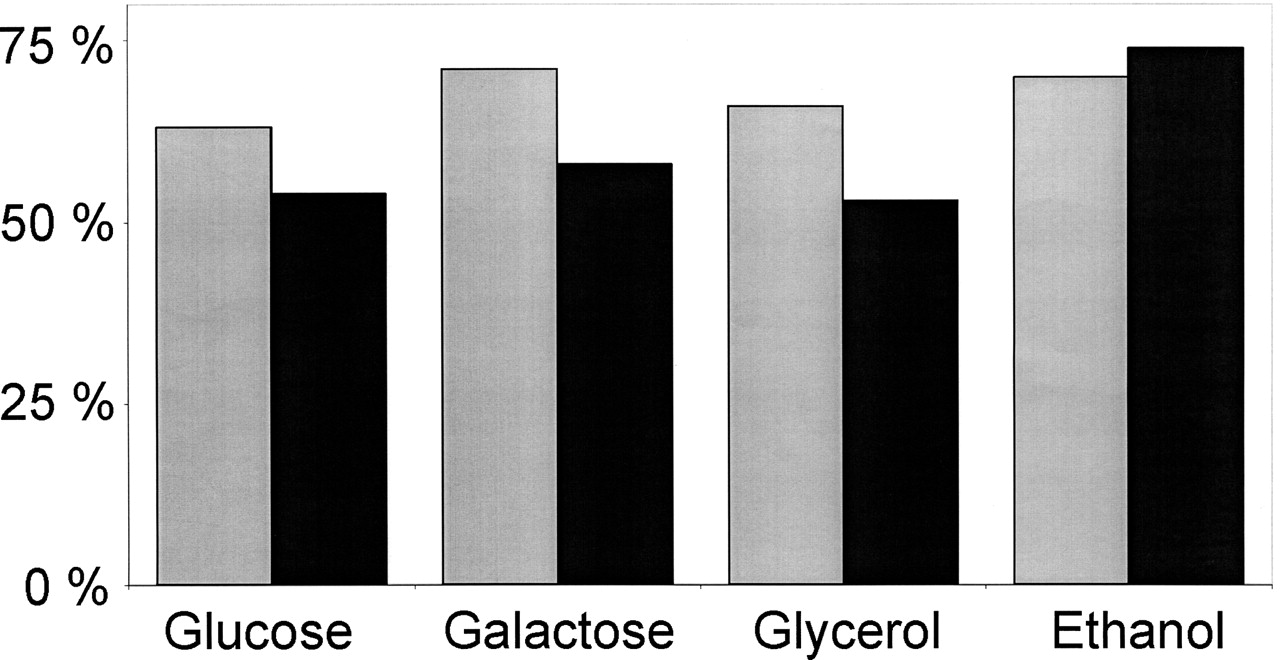
Figure 3.
Relative occurrence of singleton (gray bars) and duplicate (black bars) genes in essential reactions during growth on four different single carbon substrates. The numbers are normalized to the active reactions under each growth condition.


