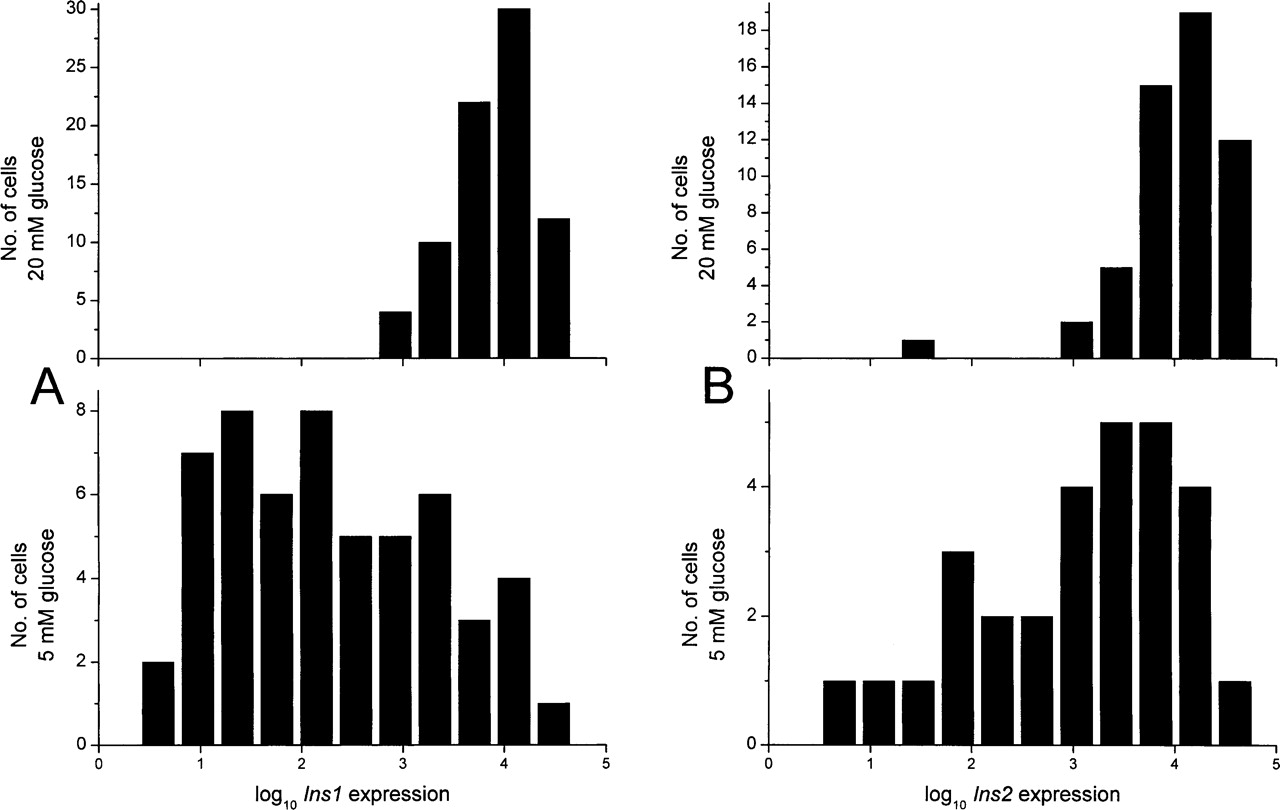
Gene expression profiling in single cells from the pancreatic islets of Langerhans reveals lognormal distribution of mRNA levels

(Downloading may take up to 30 seconds. If the slide opens in your browser, select File -> Save As to save it.)

Click on image to view larger version.

Figure 2.
Figure 2.

(A) Histograms of Ins1 expression levels in cells incubated in 5 mM (bottom) and 20 mM (top) glucose. Horizontal axis has logarithmic scale, which is identical in the two histograms. Scale on the vertical axis indicates the cell count in each histogram bin. (B) Corresponding histograms for Ins2 expression levels.

This Article

  1. Genome Res. 15: 1388-1392

Preprint Server