
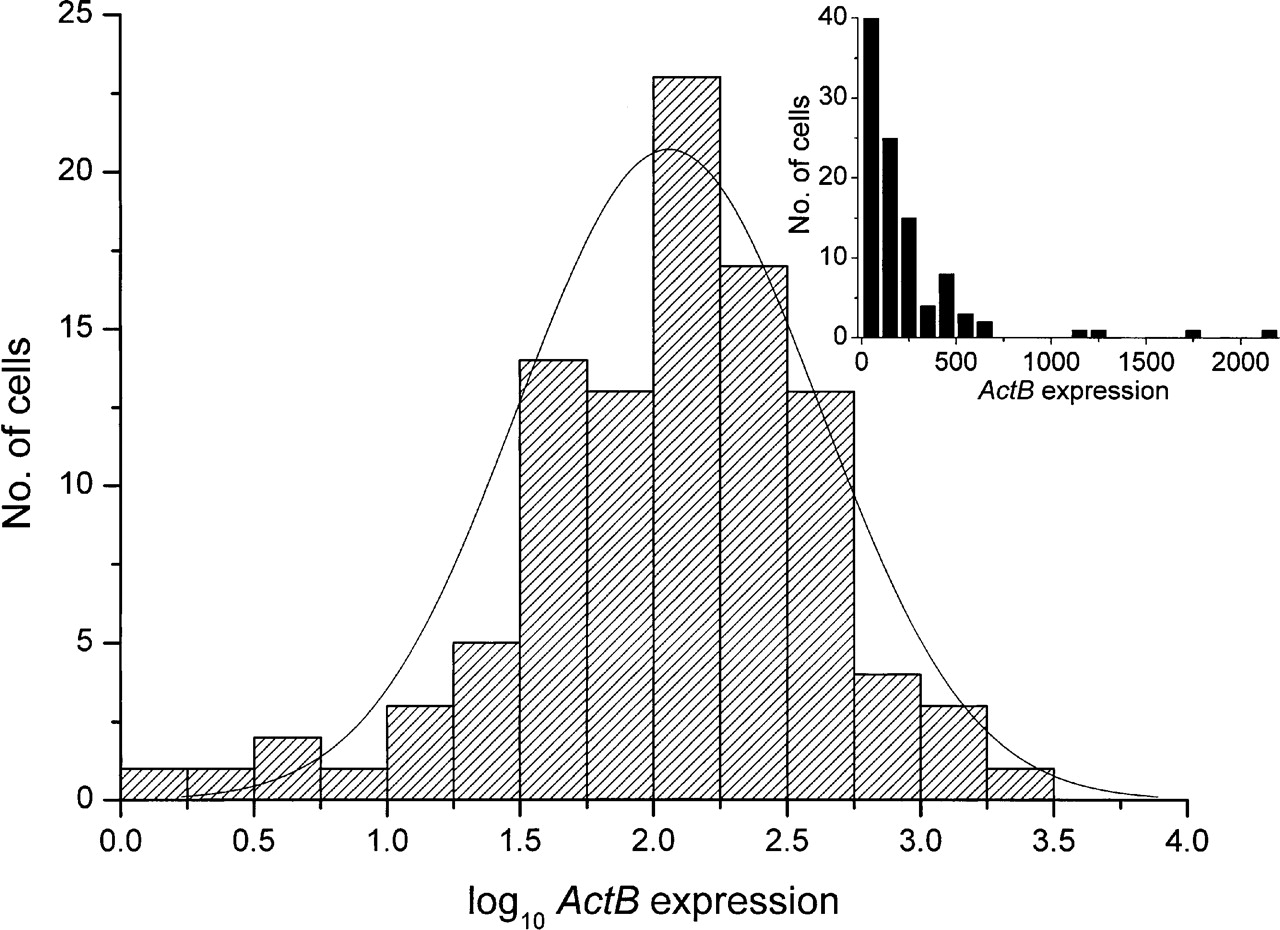
Figure 1.
Histograms showing the expression levels of 96 cells expressing ActB in logarithmic and linear scale (inset). Logarithms of transcript levels are mean-centered for the two glucose concentrations. Solid line describes lognormal distribution centered on the geometric mean (2.06) of the ActB expression levels. Inset shows histogram of the expression levels in linear scale.


