
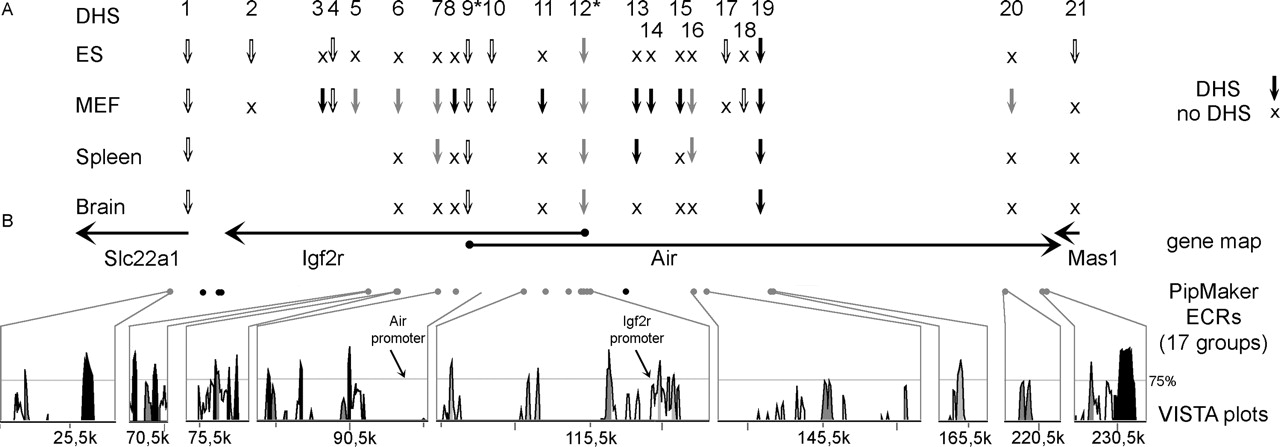
Overview of DHS and evolutionary conservation. The position and regulation of the 21 DHS identified in the 192-kb Mas1-Slc22a1 interval are shown relative to mouse-human evolutionarily conserved regions (ECRs). (A) Numbered vertical arrows indicate the position of all identified DHS relative to the gene map and ECRs; “X” indicates regulated DHS absent in the tested sample; a blank space indicates the sample was not tested. For each cell line (ES, MEF) and organ (spleen, brain), all identified DHS were shown on one line. Open arrows represent single or multiple DHS at regions free of interspersed repeats but >2 kb distant from ECRs (DHS 1-2, 4, 9-10, 17-18, 21); black arrows mark DHS located at an interspersed repeat (DHS 3, 8, 11, 13-15, 19); shaded arrows show repeat-free DHS located within 2 kb of an ECR (DHS5-7, 12, 16, 20). The parental-specific DHS12 at the Igf2r promoter and DHS9 at the Air promoter are marked by an asterisk. Note that DHS11 is most likely a cell line-specific DHS. The lack of DHS between DHS19 and DHS20 is due to incorrect sequence insertions presented in Figure 1. (B) The positions and transcriptional orientation of the genes are indicated by horizontal arrows; solid circles at the start of the arrow indicate CpG island promoters; the Mas1 promoter has not yet been identified. Below the gene map, ECRs, selected from the PipMaker output (defined in Fig. 2), are indicated by filled circles. Gray circles indicate PipMaker ECRs associated with a DHS that were also shown below as conservation peaks in the output of the VISTA program (Mayor et al. 2000). Black circles indicate PipMaker ECRs not shown in the VISTA output. The VISTA plots in the bottom panel display the percent identity of the human and mouse genomic sequence relative to the mouse sequence but only values above 50% are shown. Conserved exons are indicated by black shading and the conservation peaks, corresponding to the PipMaker ECRs, in gray. The location of the Igf2r and Air promoter are indicated with arrows; note that the Air promoter lacks sequence conservation.


