
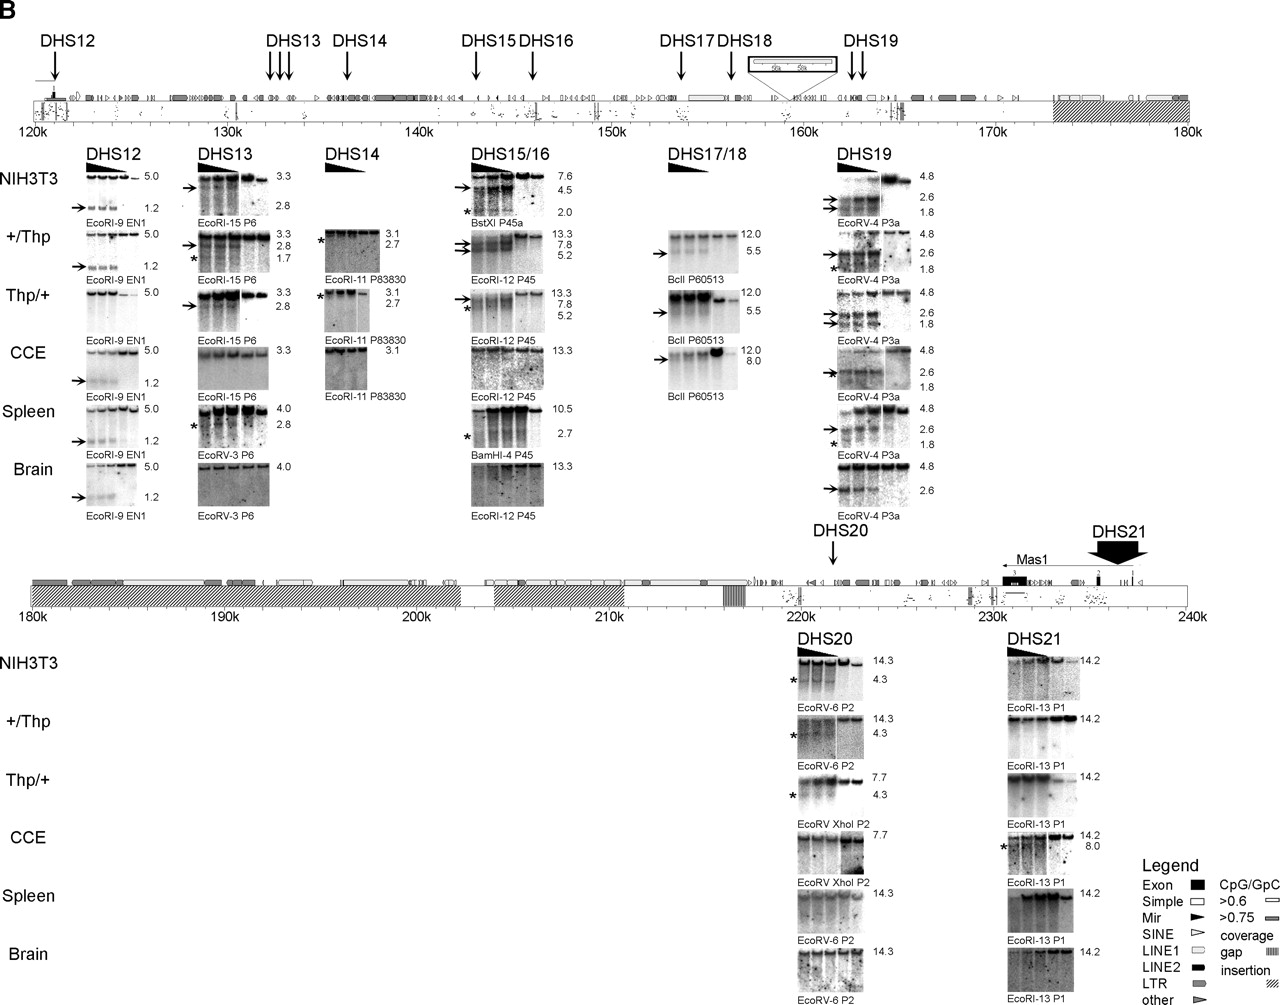
DHS map of the Igf2r/Air cluster. All identified DHS were shown at their correct position within the genomic organization of the investigated region. Because of its length, this region is presented in two parts. (A) The region from Slc22a1 to the Igf2r promoter; (B) the region from the Igf2r promoter to Mas1. Note that blots from DHS12 at the Igf2r promoter are shown in A (BglII fragments) and B (EcoRI fragments) to show the overlap between the two maps. The PipMaker plot (Schwartz et al. 2000) above the DNA blots shows the position and transcriptional orientation of genes by numbered exons (black boxes) and horizontal arrows on top of the sequence, together with the gene name. Symbols indicating positions of repeats identified by RepeatMasker (A.F.A. Smit, R. Hubley and P. Green, unpubl.) and CpG islands are shown (see legend). Evolutionary conservation to the human sequence between 50% and 100% is shown below by short horizontal bars in the PipMaker plot. ECRs defined as >70% identity over >50 bp, excluding exons and interspersed repeats are indicated by gray vertical bars within the PipMaker plot. Sequences not investigated for DHS, as well as erroneously assembled sequence insertions (Supplemental Fig.1), are indicated by hatched boxes. The strain 129Sv specific LINE insertion (Supplemental Fig.1) is indicated by a white box above the PipMaker plot in B; numbers in this box refer to sequence AJ249895. Note that the 12-kb BclI fragment shown for DHS17 and DHS18 in B is created by this LINE insertion, as the ENSEMBL m33 sequence predicts a 19-kb BclI fragment (see Fig. 1 and Supplemental Table 1). The mapped positions of identified DHS are indicated by vertical arrows together with the name of the DHS with closely related DHS combined under one name. For each identified DHS, a representative set of DNA blots is shown from MEF cell lines [NIH3T3 wild type (+/+), MEF-B1: paternal Thp deletion (+/Thp), MEF-F: maternal Thp deletion (Thp/+)], from CCE embryonic stem cells, and from spleen and brain of an adult FVB mouse. DNase I concentrations are indicated by a black triangle above the blot; the two lanes on the right side of each blot contain nuclei treated only with incubation buffer at 0°C and 37°C. The enzyme used for restriction digests and the hybridization probe are indicated for each blot (location of used restriction fragments and probes are listed in Supplemental Table 1). The DHS were visible on DNA blots as additional bands to the expected restriction fragment in lanes with DNase I treated DNA. The NIH3T3 blot of DHS8 shows an exception where two restriction fragments were visible in all lanes, which is likely due to a cell line-specific polymorphism. Strong DHS bands are indicated by horizontal arrows and weak ones by asterisks on the left of each DNA blot. The sizes of the shown fragments are indicated on the right in kilobase pairs.


