
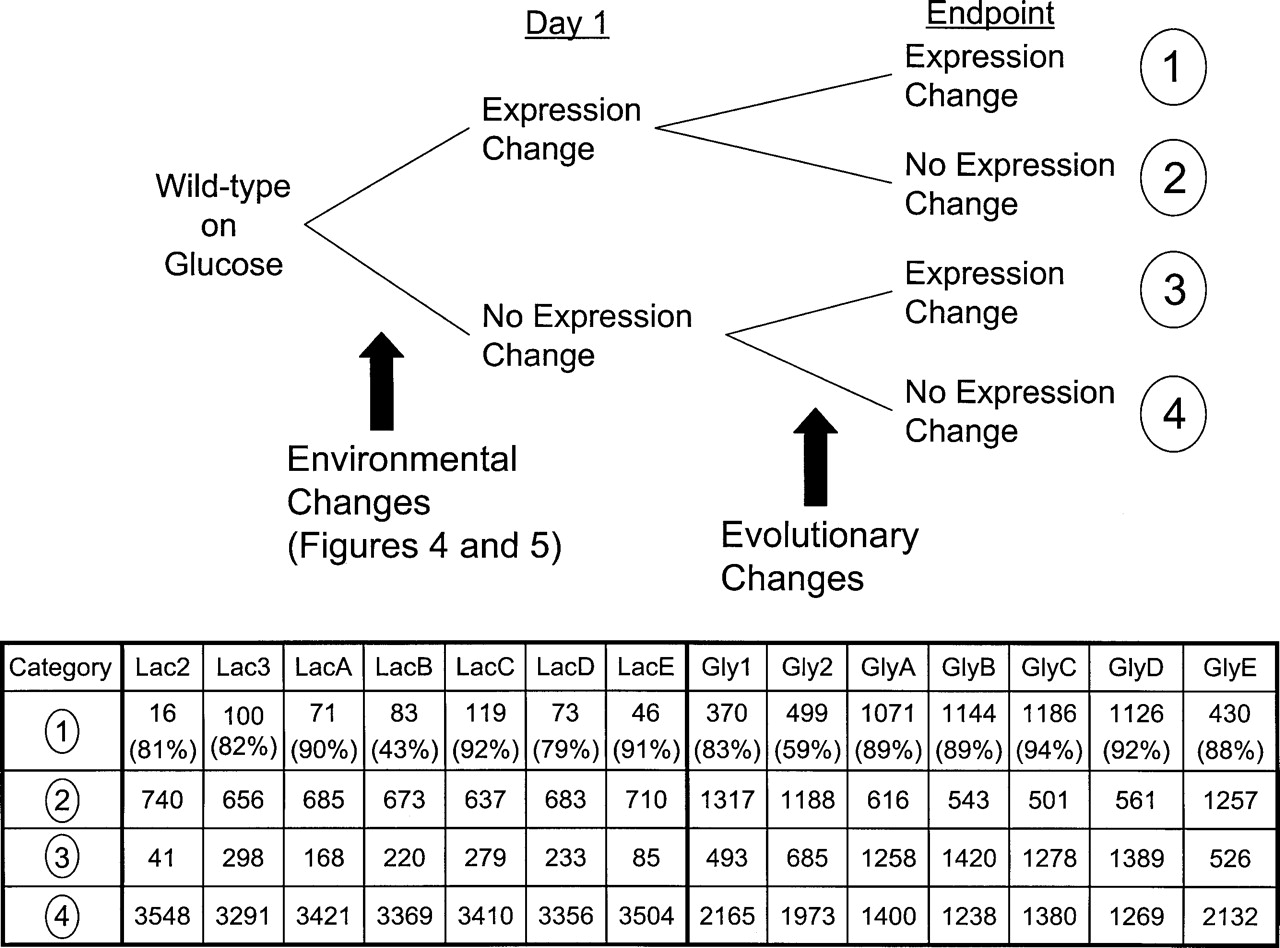
Evolutionary gene expression changes for lactate- and glycerol-evolved populations. Statistically significant gene expression changes between day 1 expression profiles and endpoint expression profiles (day 60 for lactate, day 44 for glycerol) were tabulated in four categories. Genes in category 1 had changed expression at day 1 in response to the environmental shift and had an additional change in expression during evolution. Genes in category 2 had changed expression at day 1 in response to the environmental shift but no additional expression change during evolution. Genes in category 3 only exhibited an expression change during evolution, and genes in category 4 showed no change in expression at either day 1 or at the endpoint of evolution. It should be noted that genes falling within category 1 can have expression changes during evolution that amplify expression changes observed at day 1 (larger magnitude change in same direction) or that compensate for expression changes at day 1 (similar magnitude change but in opposite direction). The percentage given for numbers in category 1 indicates the number of genes (e.g., 82%: 82 of the 100 genes in Lac3) exhibiting compensatory expression changes during evolution for that strain (i.e., initial environmental change caused increased expression and evolution led to decreased expression back to wild-type expression level).


