
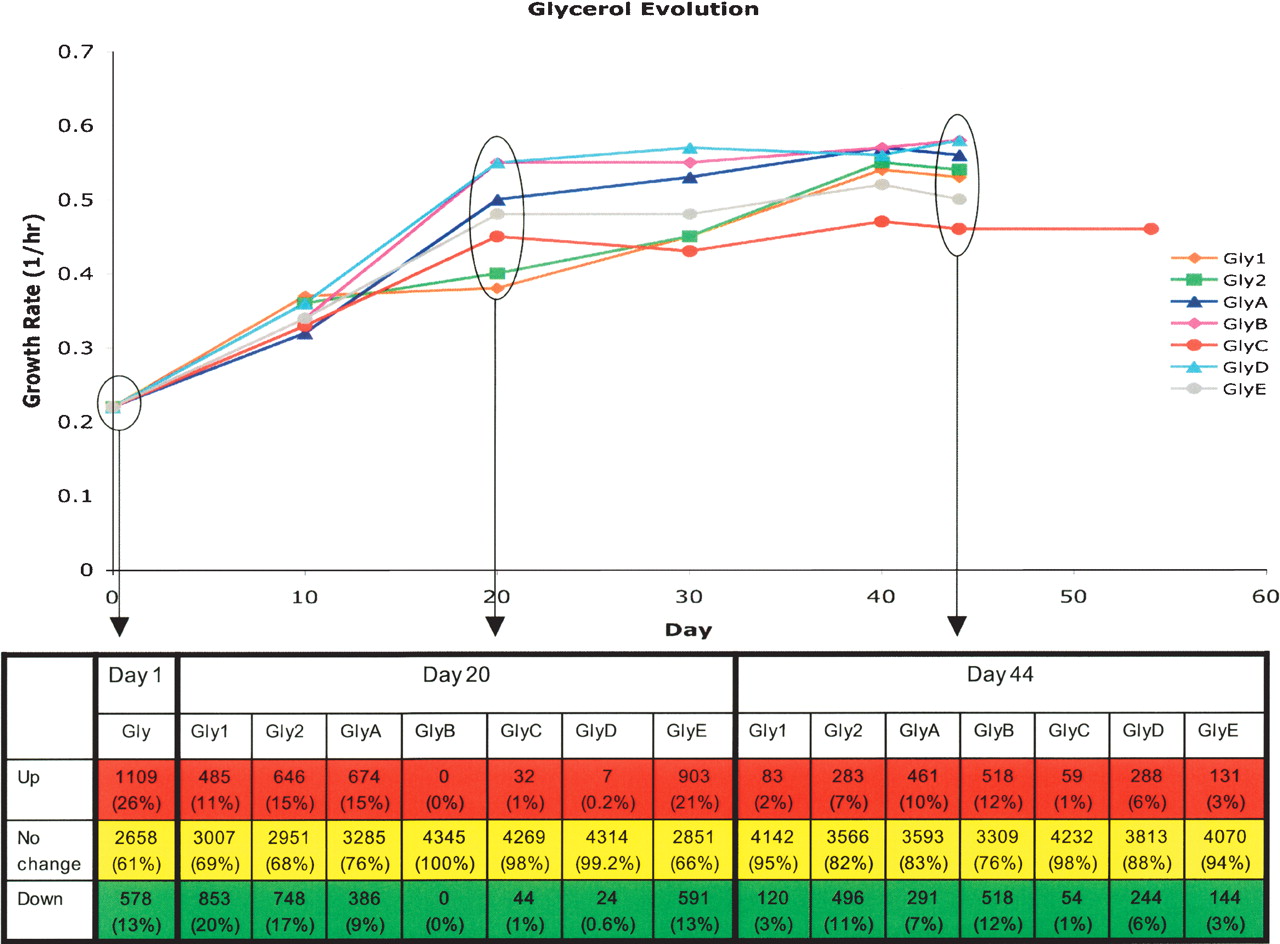
Gene expression changes in glycerol evolution populations throughout the course of adaptive evolution as compared with glucose wild-type expression profile. Growth rate changes throughout evolution are shown as a function of day of evolution with expression profiling performed at days 1, 20, and 44 of evolution. Significant expression changes from the wild-type strain grown on glucose were calculated by t-test using P-value cut-off corresponding to a false-discovery rate of 5%. By this calculation, the number of genes showing statistically significant expression changes tabulated below the plot at either increased expression compared with the wild-type (Up), decreased expression compared with the wild-type (Down), or no change in expression (No change). Percentages given in each cell indicated the percentage of genes falling within the category as a portion of the total genes.


