
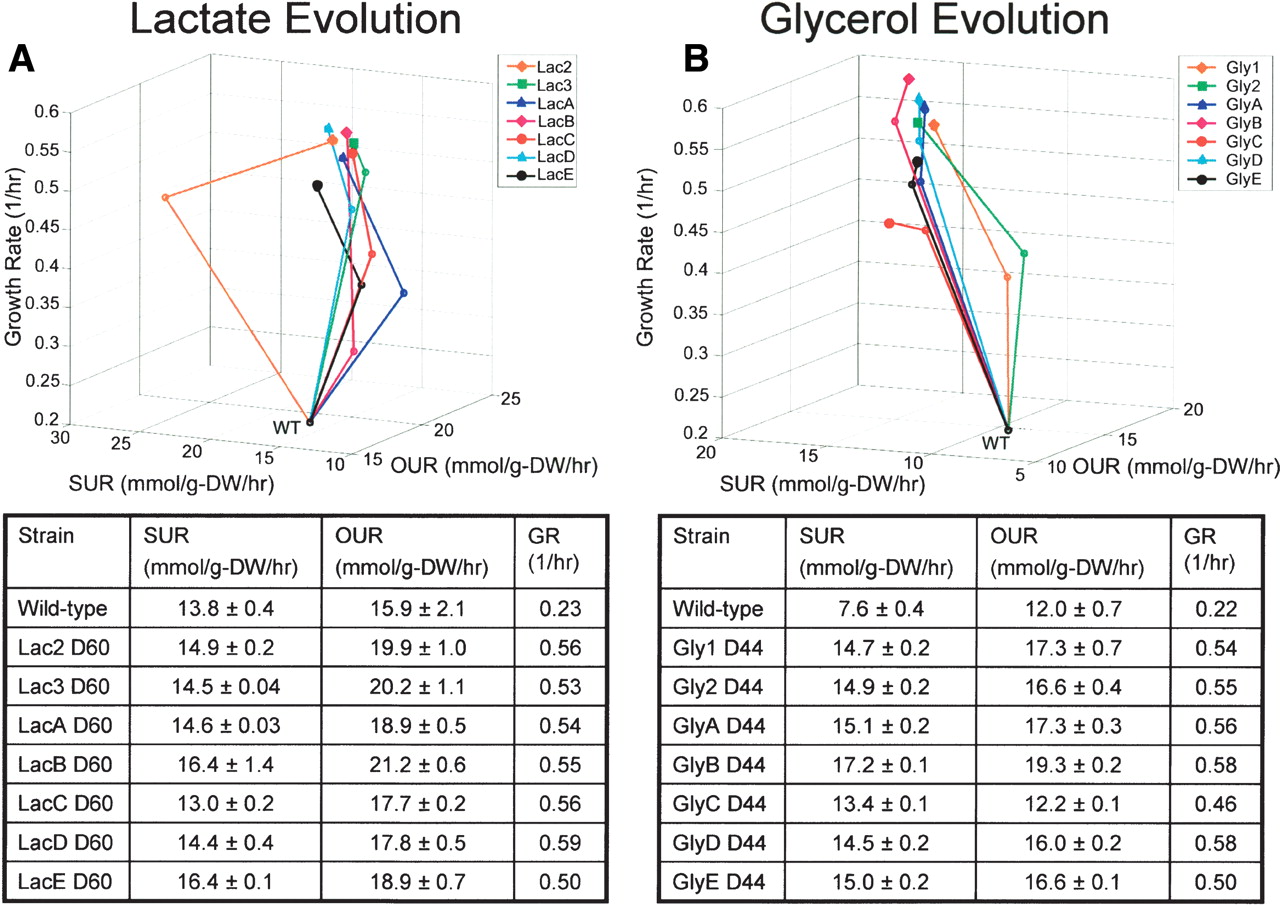
Fitness landscape depicting phenotype changes during evolution. Measured oxygen uptake rate (OUR, mmol/g-DW/hr) and substrate uptake rate (SUR, mmol/g-DW/hr) values form a plane with improved growth fitness indicated by growth rate (1/hr) on the z-axis. (A) L-lactate evolution populations were characterized at day 1, day 20, and day 60 of evolution. (B) Glycerol evolution populations were characterized at day 1, day 20, and day 44 of evolution. WT denotes the parental wild-type strain and endpoints of evolution are shown with filled symbols. Tables show phenotype measurements for the wild-type (unevolved) and endpoints of evolution with error shown as the standard deviation between replicate measurements.


