
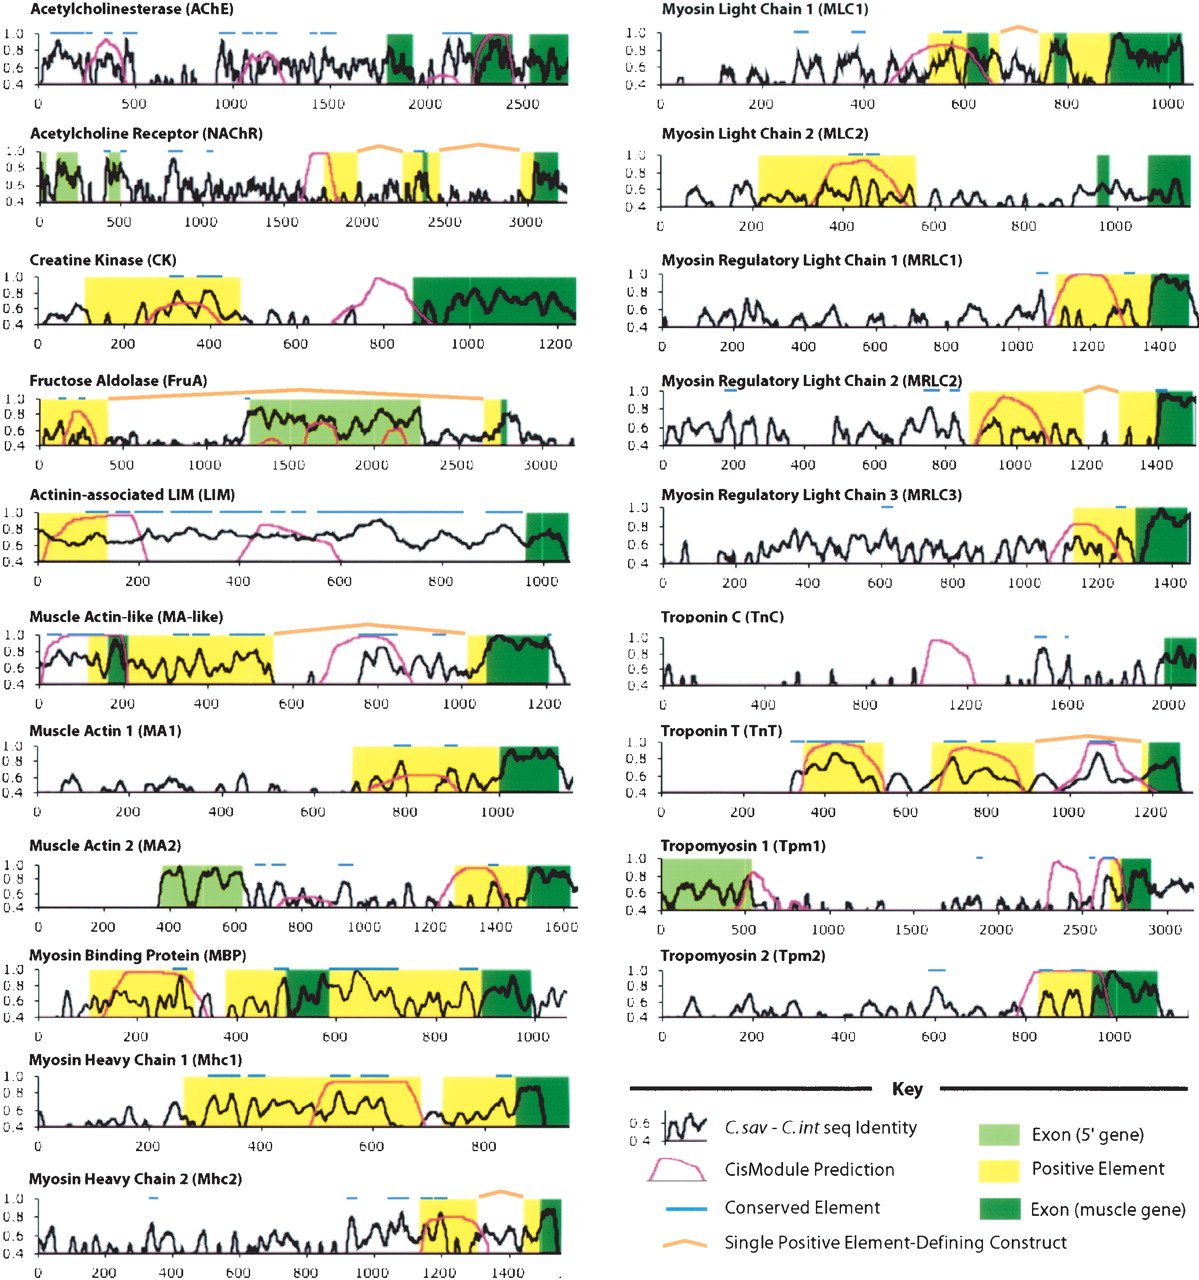
Figure 3.
Summary of functional and computational annotations at each of the 20 loci. The key is the same as in Figure 2, except that detailed functional annotations are omitted (for those, see Supplemental Fig. 2). Here, light green shading represents exons from neighboring genes, and position 0 is the position of the forward primer for the original construct. Orange bars link PEs that have internal deletions from the original functional constructs and are therefore noncontiguous on the identity plot.


