
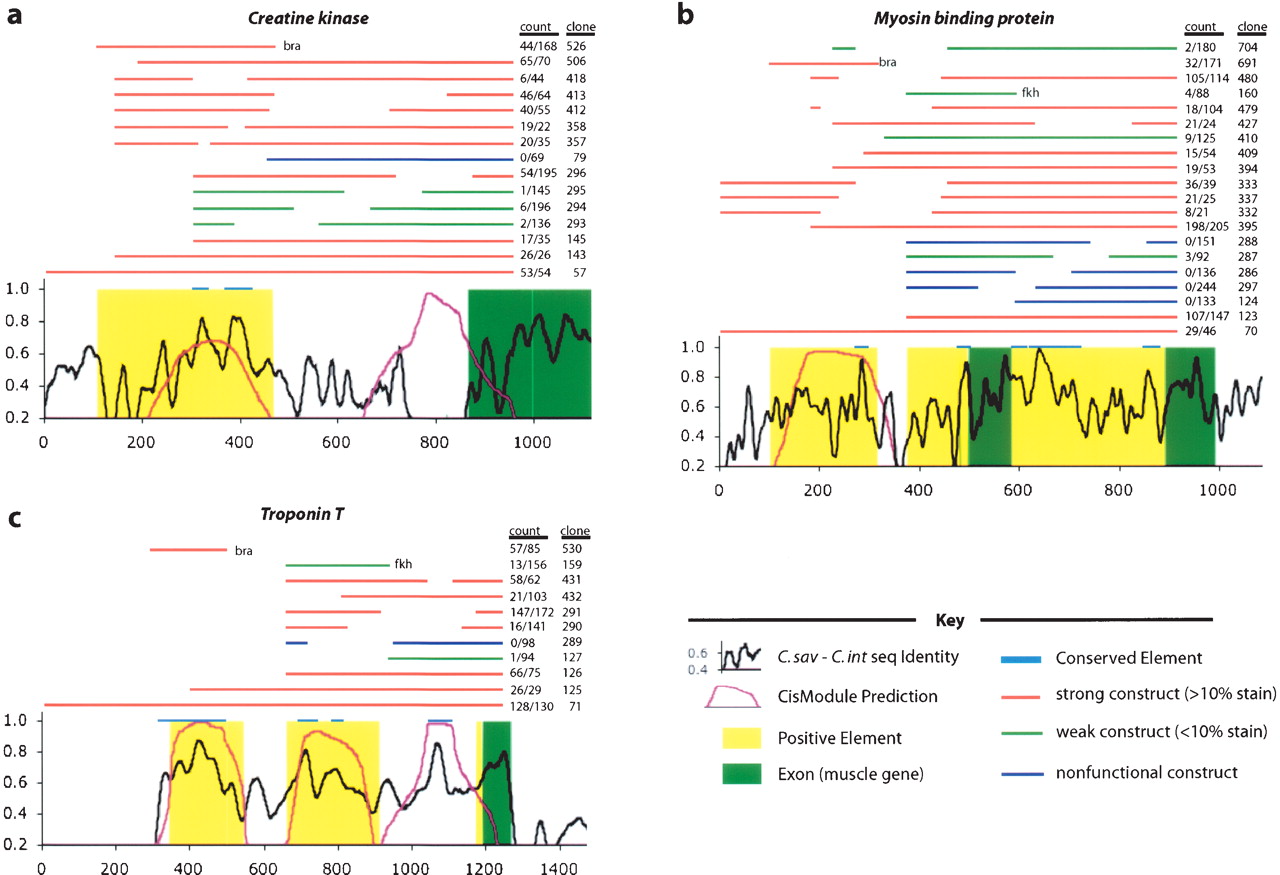
Detailed annotations of the loci Creatine Kinase (a), Myosin Binding Protein (b), and Troponin T (c), illustrate the functional and computational analyses carried out in this study. The x-axis represents base pair position in the C. savignyi sequence, with the origin at the first base of the original construct. The black line is sequence identity between C. savignyi and C. intestinalis, the plum line is the CisModule score of predicted module instances (CMs). Blue bars at 1.0 represent conserved windows at 75% for at least 20 bp (CEs). Green shading represents exons, and yellow shading represents PEs. Bars above these annotations represent the positions of DNA constructs electroporated in vivo, with red representing strong activity, green representing weak activity (<10%), and blue representing constructs that never showed activity. The construct name and percentage of staining tail muscle are listed to the right of each construct. Most plasmids are native fusions, although some are heterologous promoter fusions (denoted by bra or fkh, where appropriate).


