
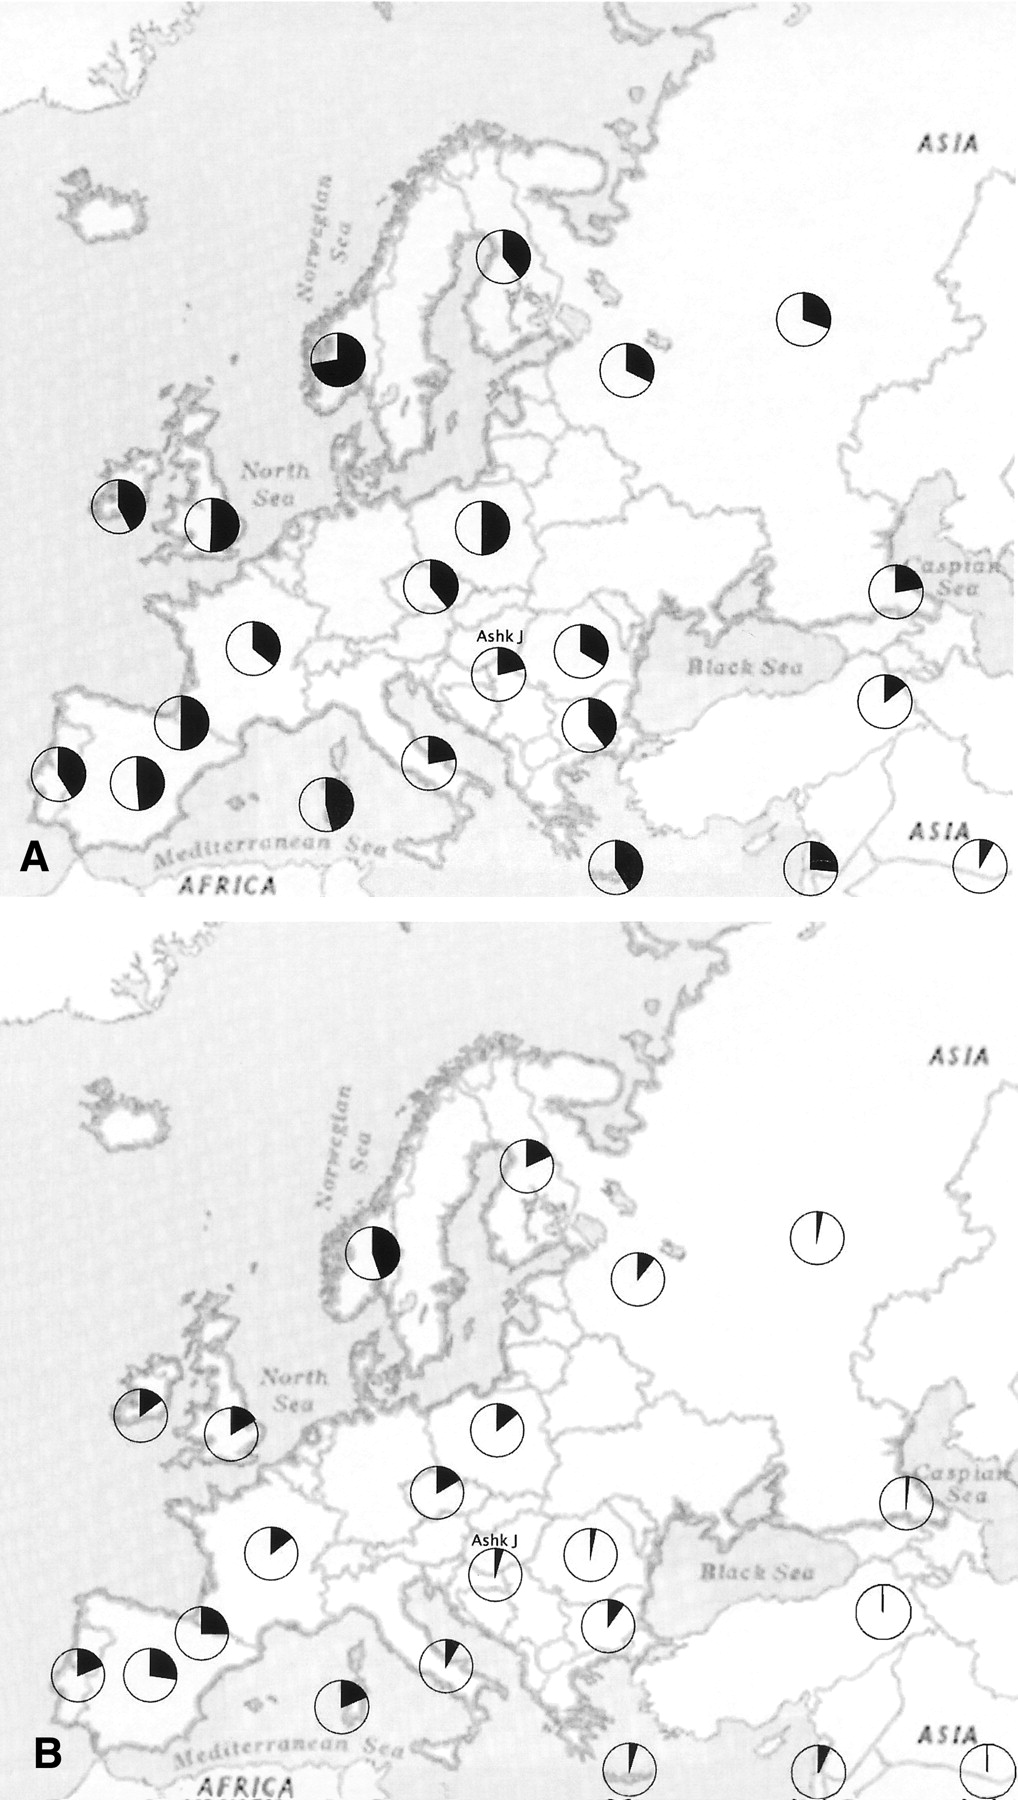
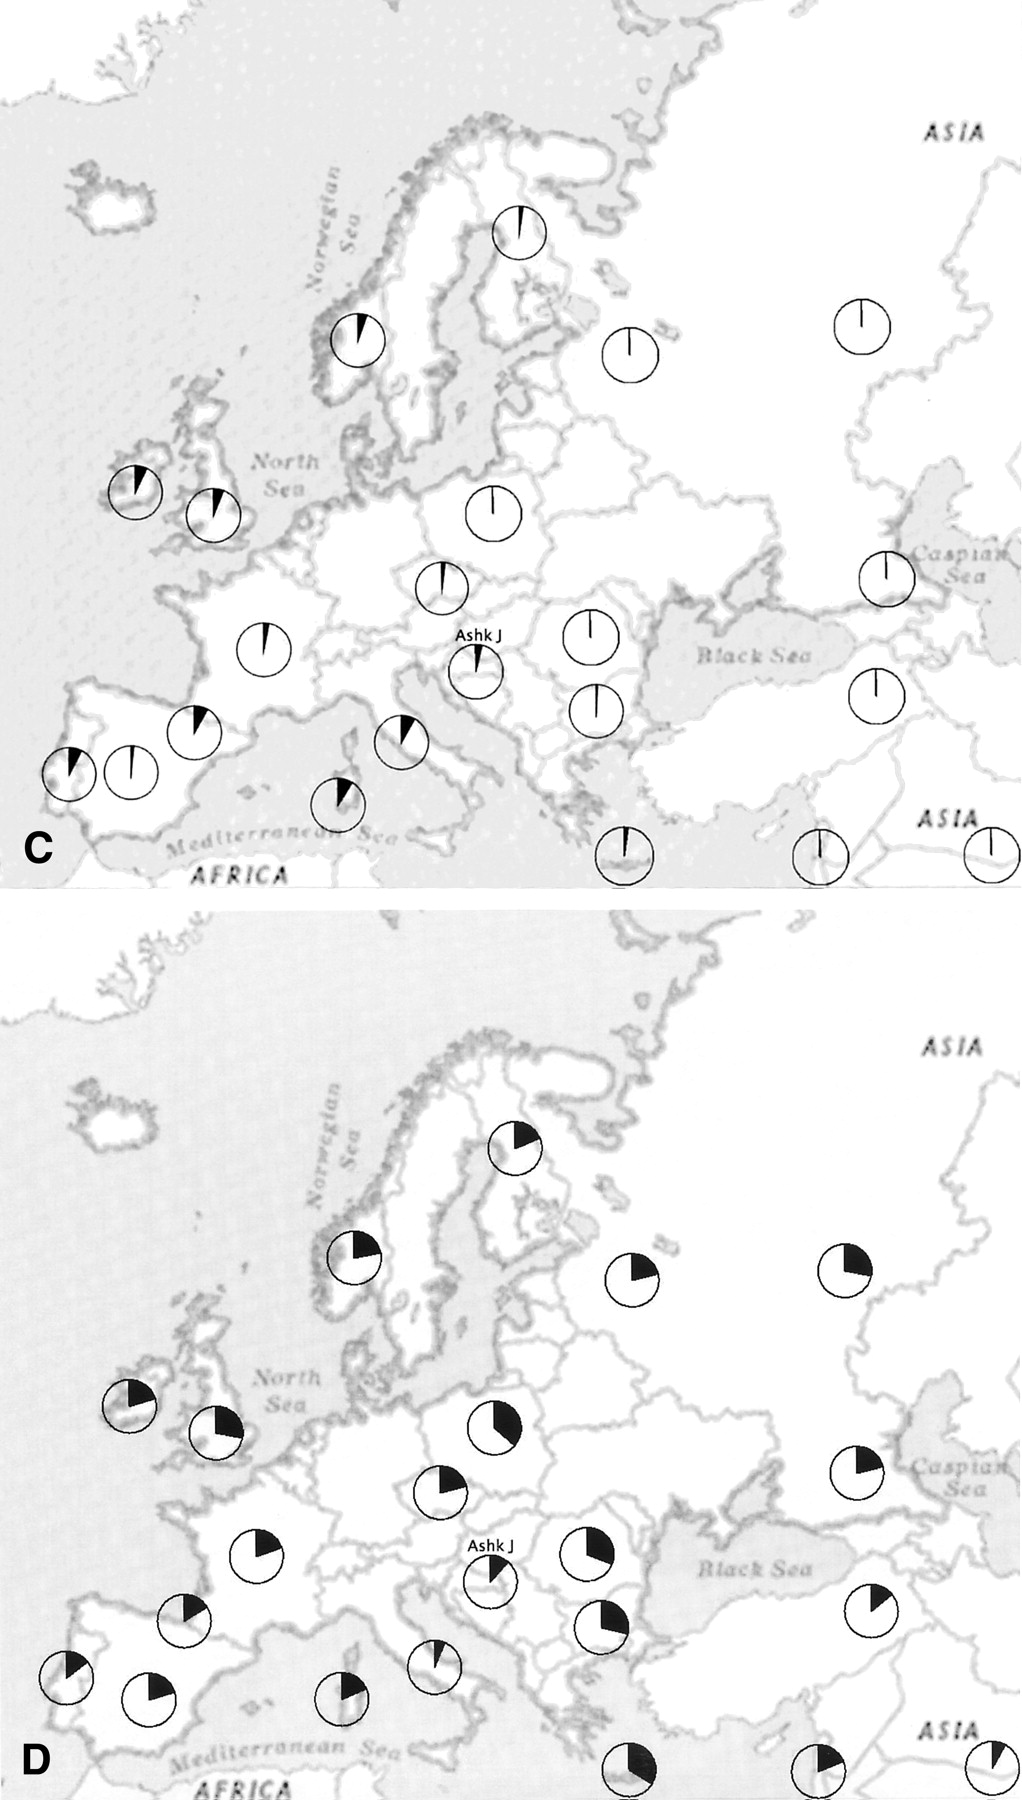
Figure 2.
Frequency distributions of haplogroups H (A), H1 (B), H3 (C), and H less H1 and H3 (D) in Europe, the Caucasus and the Near East.
(Downloading may take up to 30 seconds. If the slide opens in your browser, select File -> Save As to save it.)
Click on image to view larger version.
Frequency distributions of haplogroups H (A), H1 (B), H3 (C), and H less H1 and H3 (D) in Europe, the Caucasus and the Near East.
 CiteULike
 Delicious
 Digg
Digg Facebook
 Google+
 Reddit
 Twitter
