
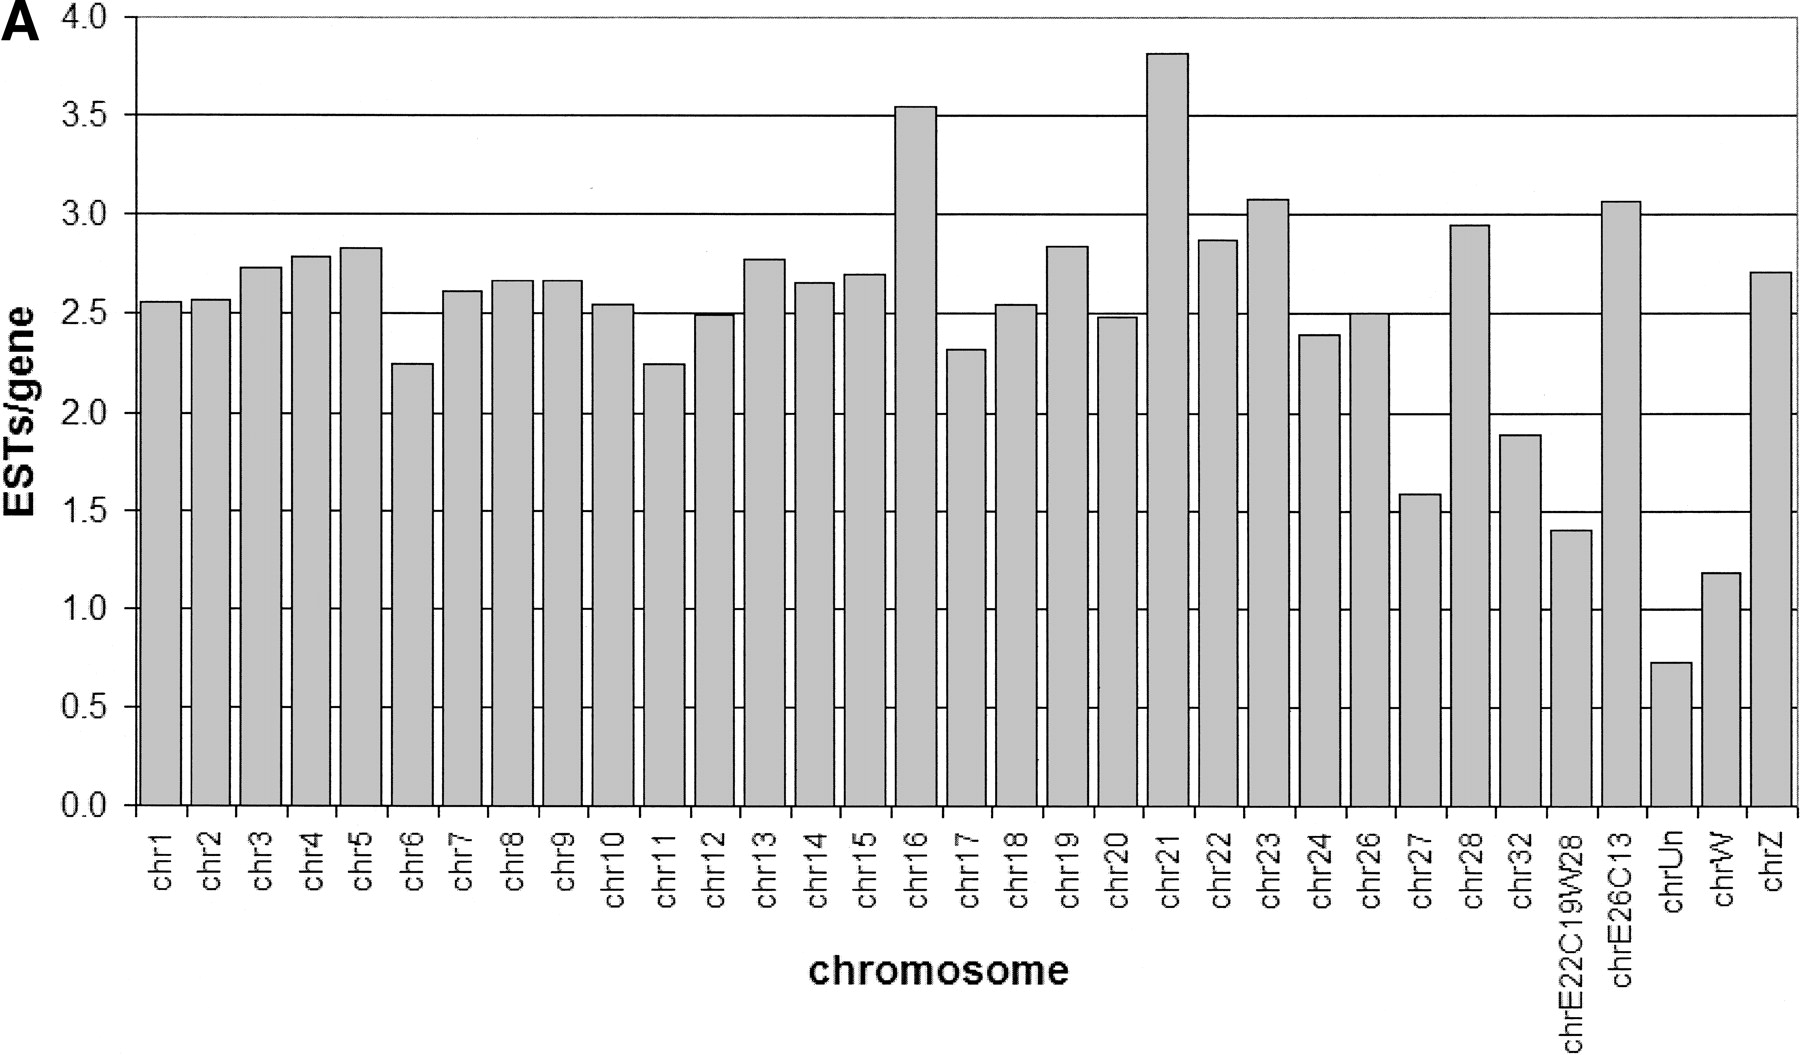
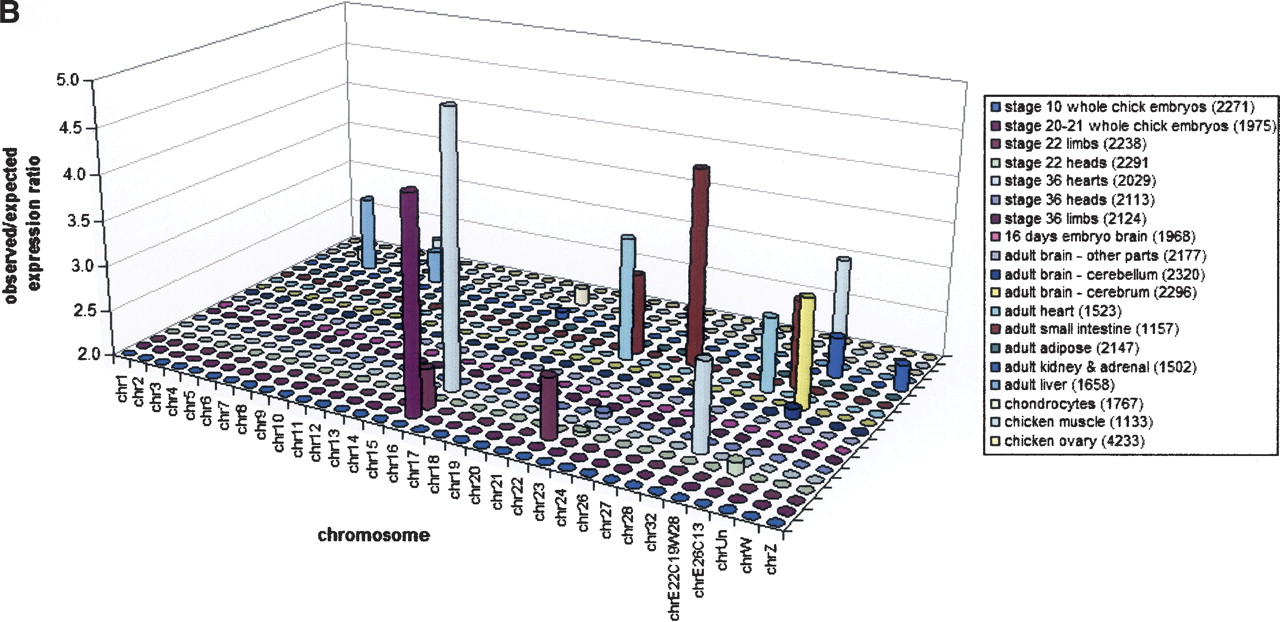
Distribution of ESTs across the chicken genome. (A) The subset of 39,362 ESTs from non-normalized cDNA libraries mapped to each individual assembled chromosome is shown, normalized by the number of genes on each chromosome, plotting the number of EST hits per gene. (B) Tissue-specific expression patterns for ESTs mapped to the genome. Only ESTs from nonnormalized cDNA libraries were used, and the ratio of actual to expected ESTs mapping from each tissue onto each chromosome is plotted, showing only those cases where the ratio exceeds two. Expected expression levels were calculated as the total number of ESTs expressed by each tissue multiplied by the fraction of all genes located on each given chromosome. Bars shown indicate tissues showing above-expected expression of ESTs on a particular chromosome, where all values are significant at P < 0.001. The legend shows the number of ESTs from each tissue mapped to the genome in brackets after each library name.


