
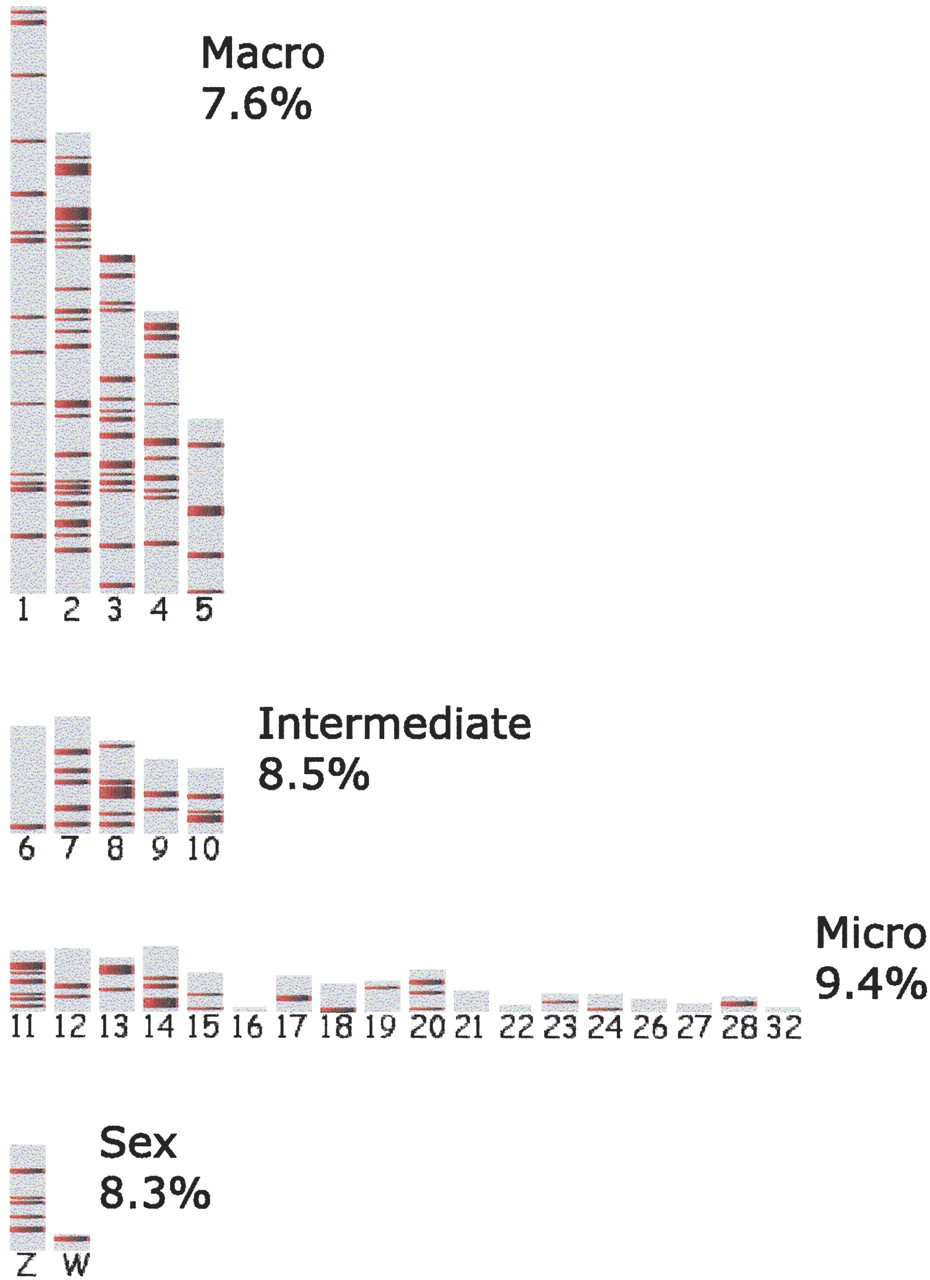
Figure 7.
Distribution of stable gene deserts in the chicken genome (plotted as red lines). Chicken chromosomes are grouped into macro, intermediate, micro, and sex categories with the numerical characterization of average chromosome coverage by the stable gene deserts.


