
Figure 5.
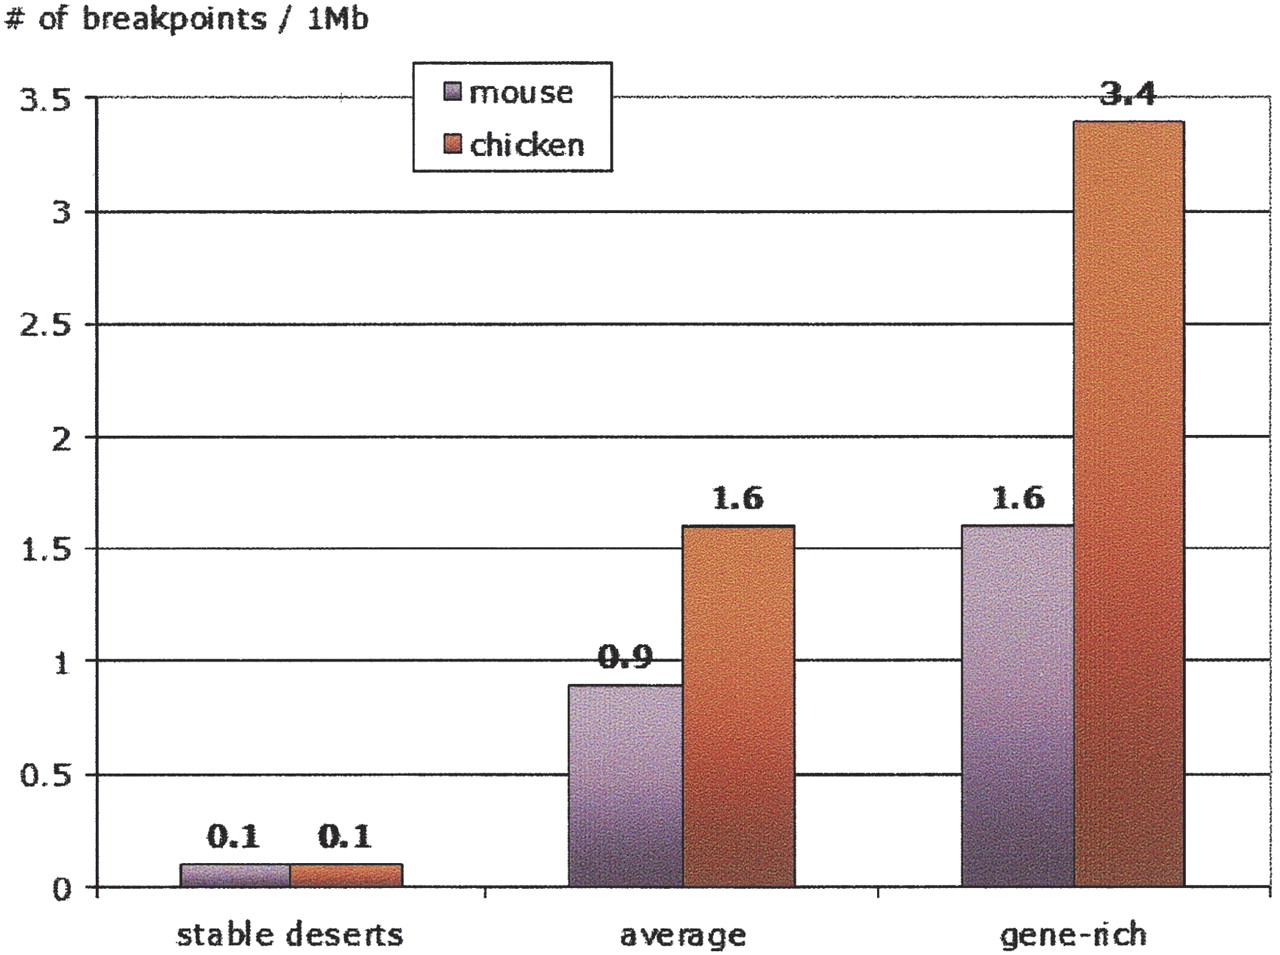
Density of synteny breakpoints per 1 Mb of sequence. Human–mouse comparisons are in orange; human–chicken in lilac.
(Downloading may take up to 30 seconds. If the slide opens in your browser, select File -> Save As to save it.)
Click on image to view larger version.
Density of synteny breakpoints per 1 Mb of sequence. Human–mouse comparisons are in orange; human–chicken in lilac.
 CiteULike
 Delicious
 Digg
Digg Facebook
 Google+
 Reddit
 Twitter
