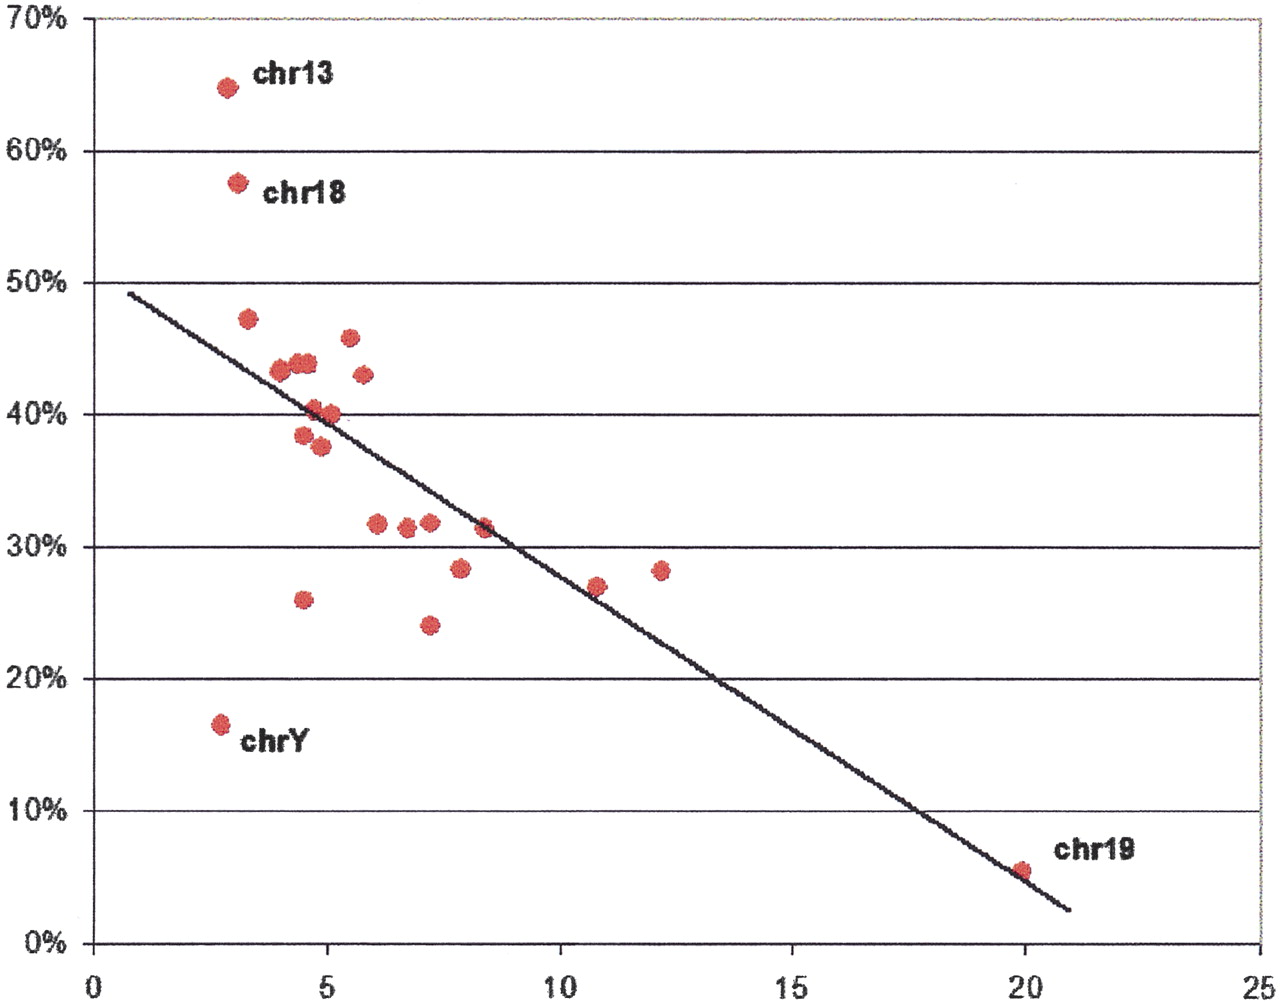
Evolution and functional classification of vertebrate gene deserts

(Downloading may take up to 30 seconds. If the slide opens in your browser, select File -> Save As to save it.)

Click on image to view larger version.

Figure 4.
Figure 4.

Percentage of genes with UTRs conserved in chicken (vertical axis) versus the gene density (based on RefSeq annotation; in genes per 1 Mb of sequence as plotted at the horizontal axis). Red dots describe different human chromosomes.

This Article

  1. Genome Res. 15: 137-145

Preprint Server