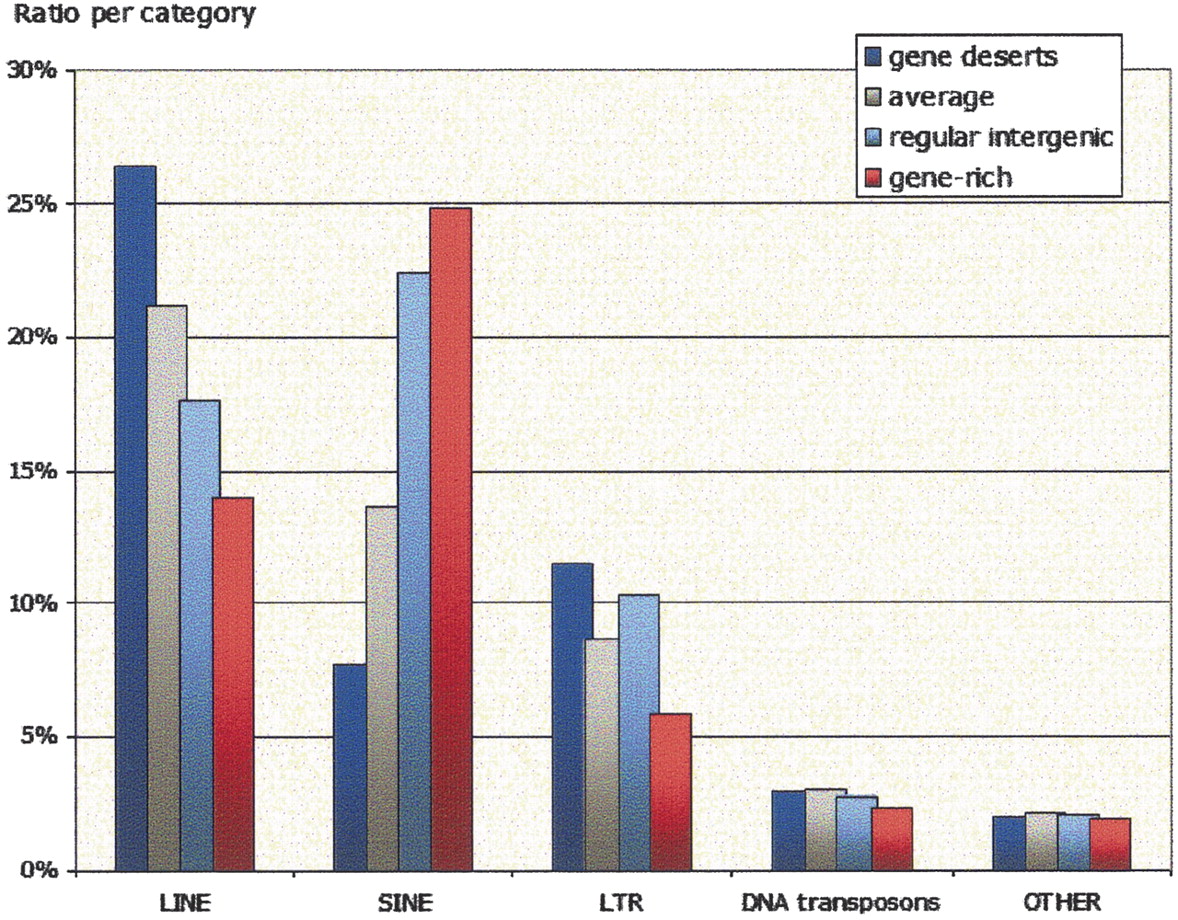
Evolution and functional classification of vertebrate gene deserts

(Downloading may take up to 30 seconds. If the slide opens in your browser, select File -> Save As to save it.)

Click on image to view larger version.

Figure 2.
Figure 2.

Ratio of different categories of repetitive elements populating different human genomic regions. Gene deserts are in blue, average counts for the human genome are in gray, regular intergenic regions are in light blue, and gene-rich regions are in red.

This Article

  1. Genome Res. 15: 137-145

Preprint Server