
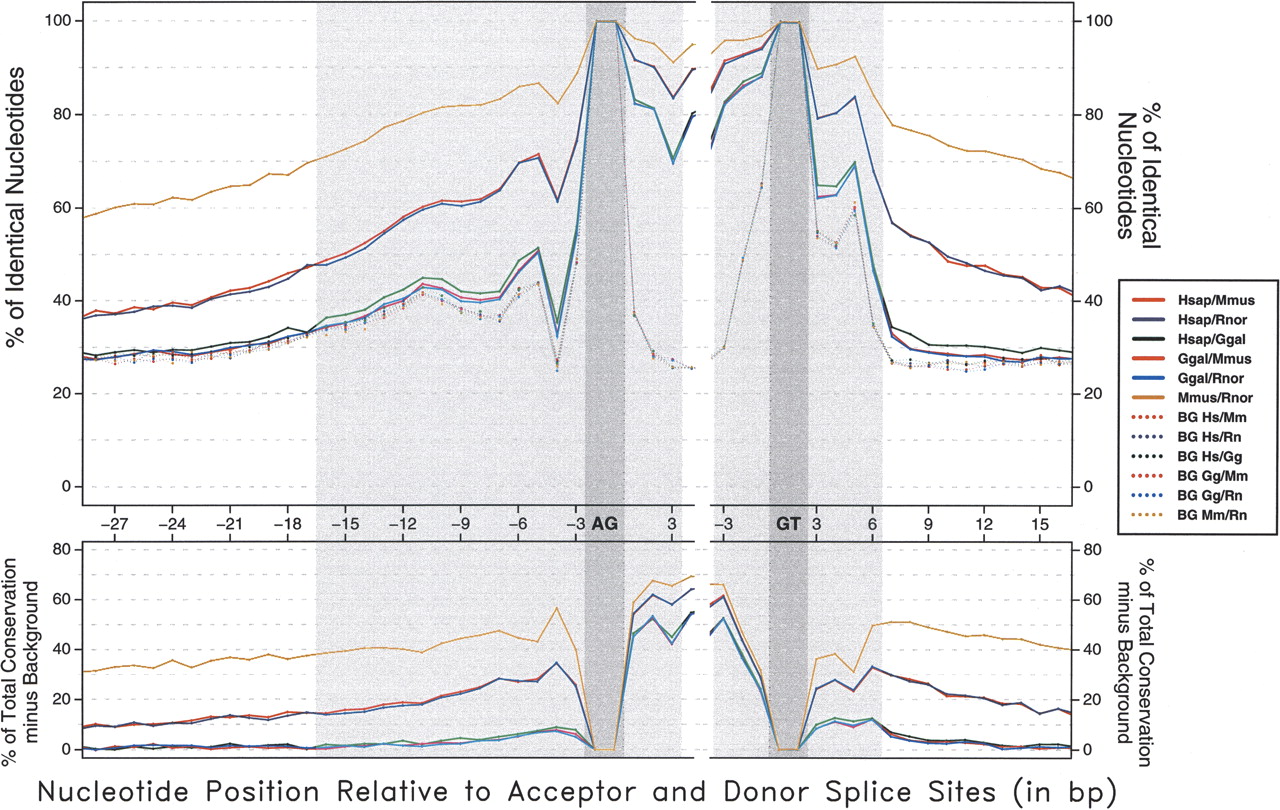
Figure 3.
Sequence conservation level of orthologous GT-AG splice sites. Shaded gray areas correspond to the typical sequence span of splice-site signals. The average identity between the orthologous sequences is plotted across the splice signals (see Discussion). Background identity has been estimated from pairs of nonorthologous sites. (Bottom) The result of subtracting background conservation from total conservation.


