
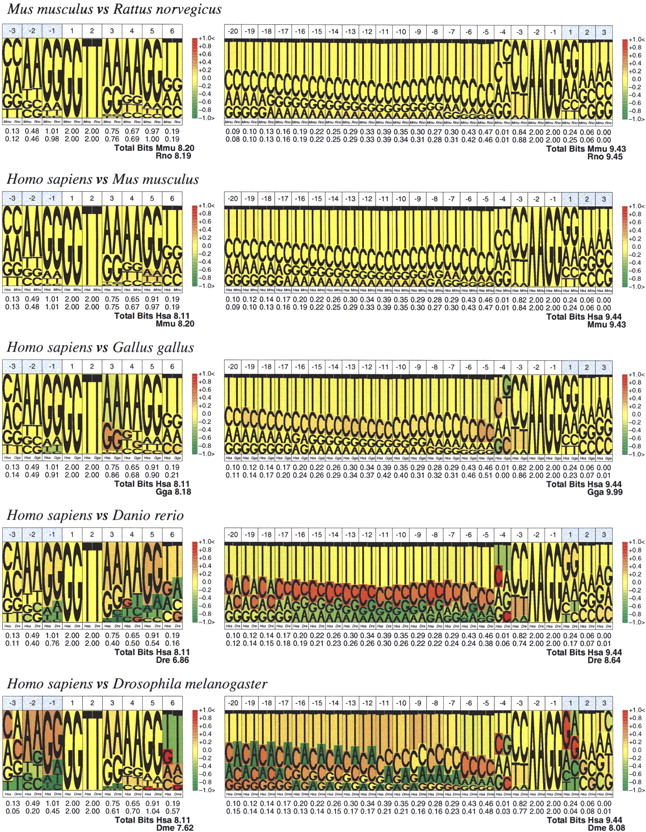
Figure 2.
Comparative pictograms for donor and acceptor splice sites. Comparative pictograms of donor and acceptor sites for pairwise comparisons between species at different phylogenetic distances. At each position, the nucleotide distribution of the two species is displayed, the height of the letters corresponding to their relative frequency at the position. The color in the background of the letters indicates the underrepresentation (green) or overrepresentation (red) of a given nucleotide in the second species (right) with respect to the first (left).


