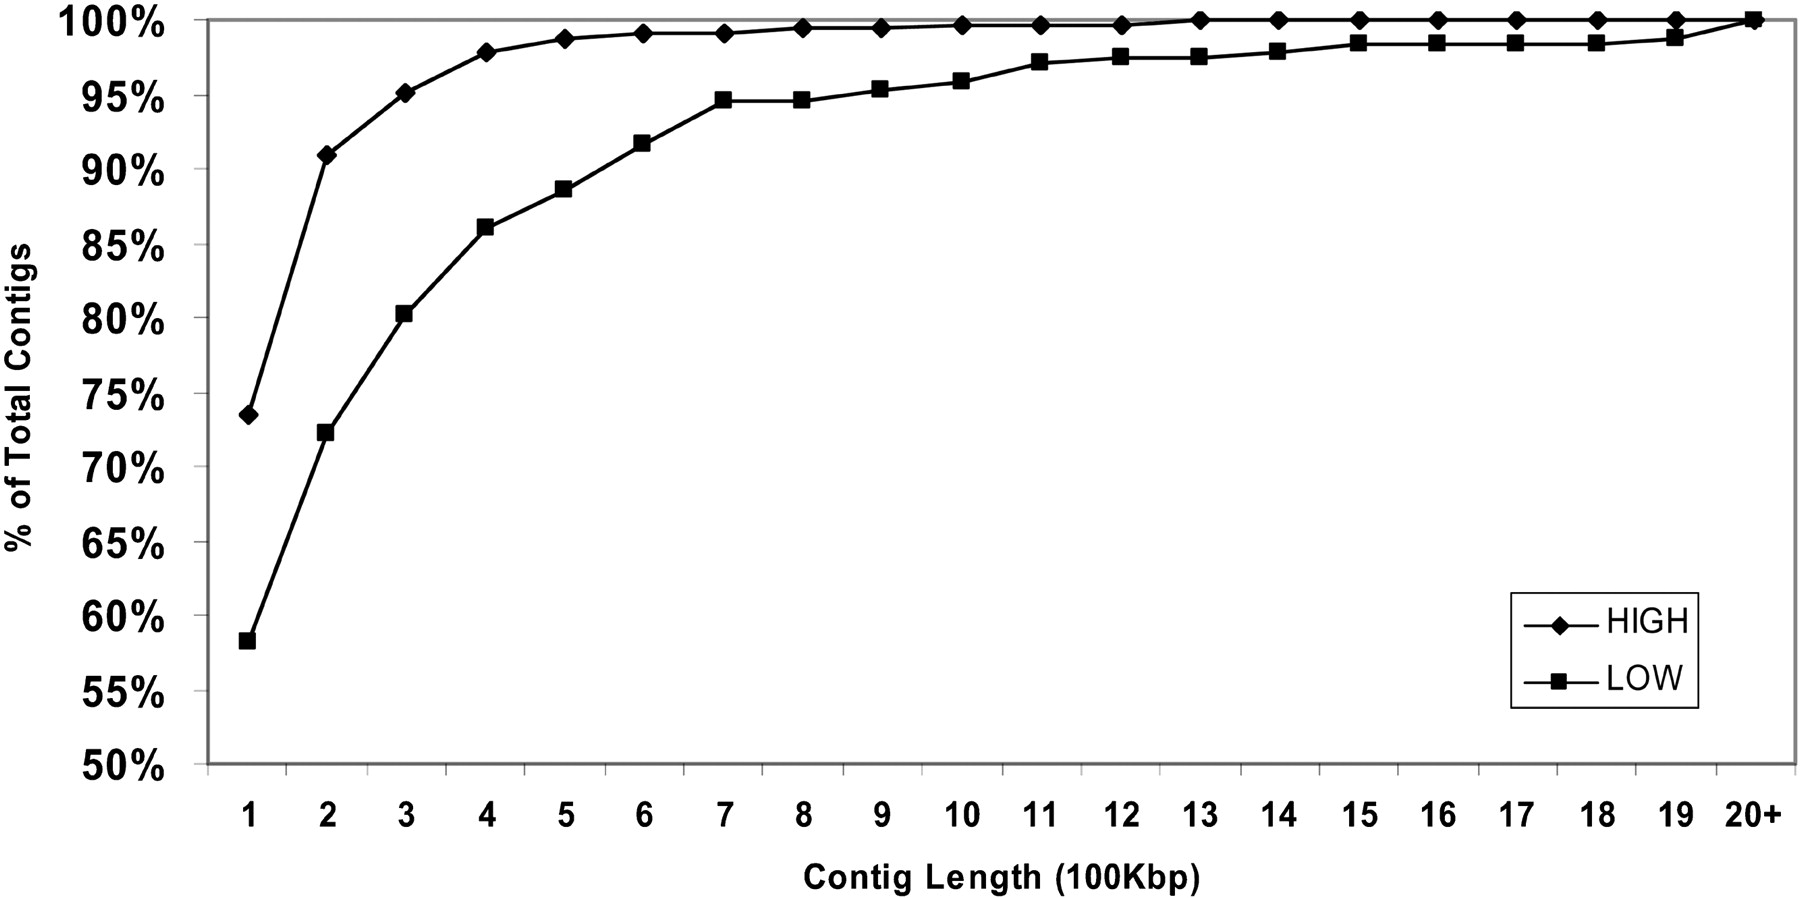
An SNP Resource for Rice Genetics and Breeding Based on Subspecies Indica and Japonica Genome Alignments

(Downloading may take up to 30 seconds. If the slide opens in your browser, select File -> Save As to save it.)

Click on image to view larger version.

Figure 2
Figure 2

Asymmetry in contigs length for regions of high and low SNP frequency. The x-axis shows the contig length in 100 kb bins for regions of high (diamond) and low (square) SNP frequency. The y-axis shows the cumulative percent of total contigs that fall into a size range.

This Article

  1. Genome Res. 14: 1812-1819

Preprint Server