
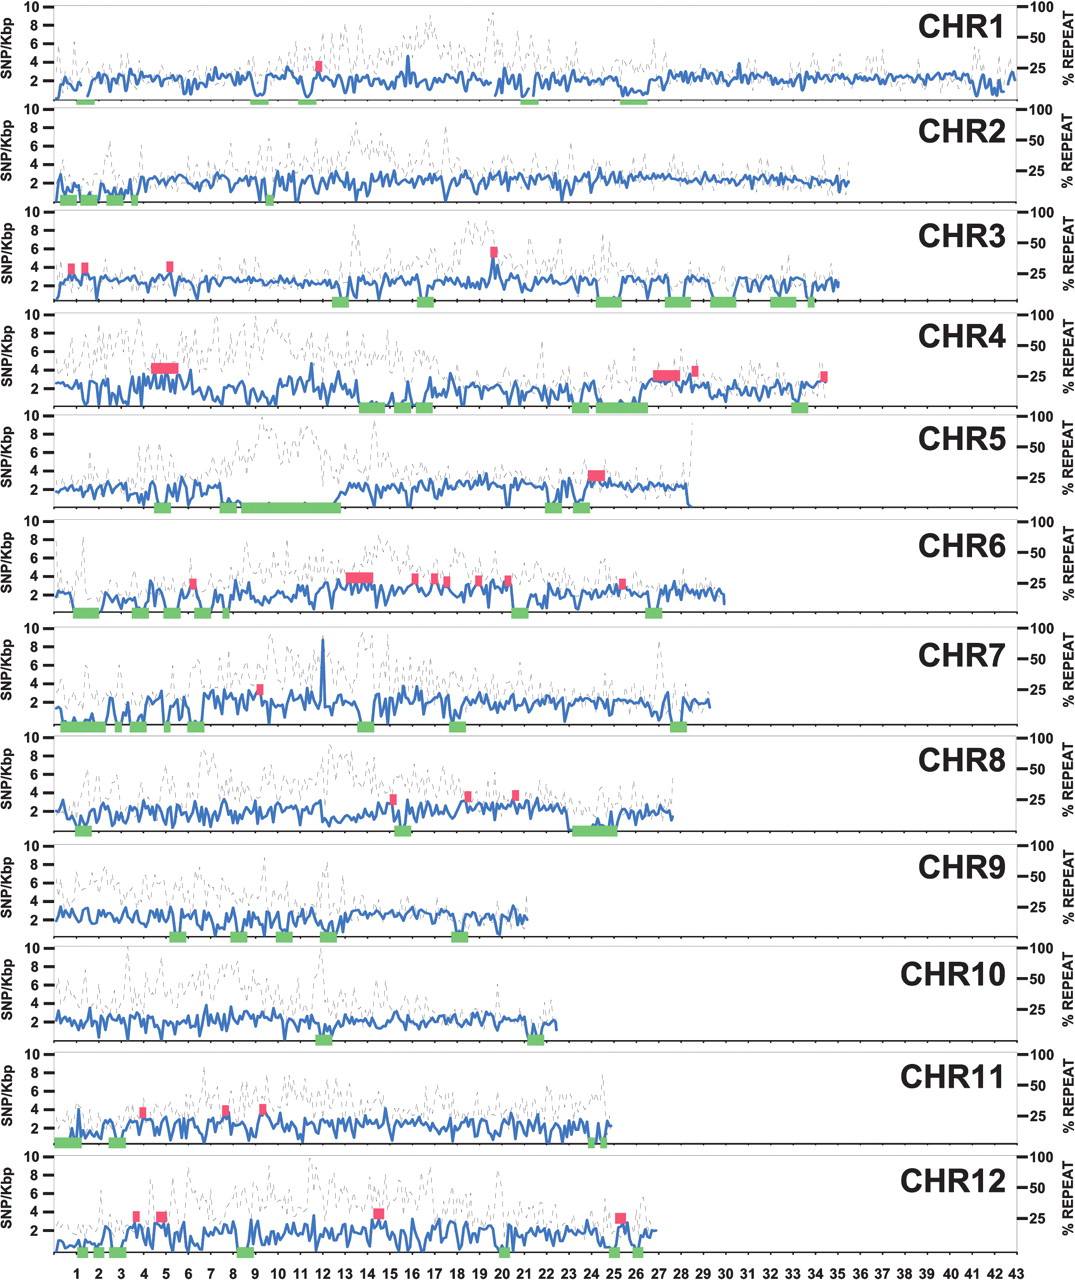
Figure 1
SNP variation across the rice genome. The x-axis shows the pseudomolecule position in which each tick-mark is a megabase. The y-axis shows the number of SNPs (solid blue line) per 100 kb of total DNA after subtraction of repetitive DNA. The right y-axis shows the percent of a 100-kb DNA stretch that is masked for repetitive DNA (dotted black line). Regions >300 kb that showed lower than expected SNP frequencies are noted with green blocks, and regions of higher than expected SNP frequencies are noted with red blocks.


