
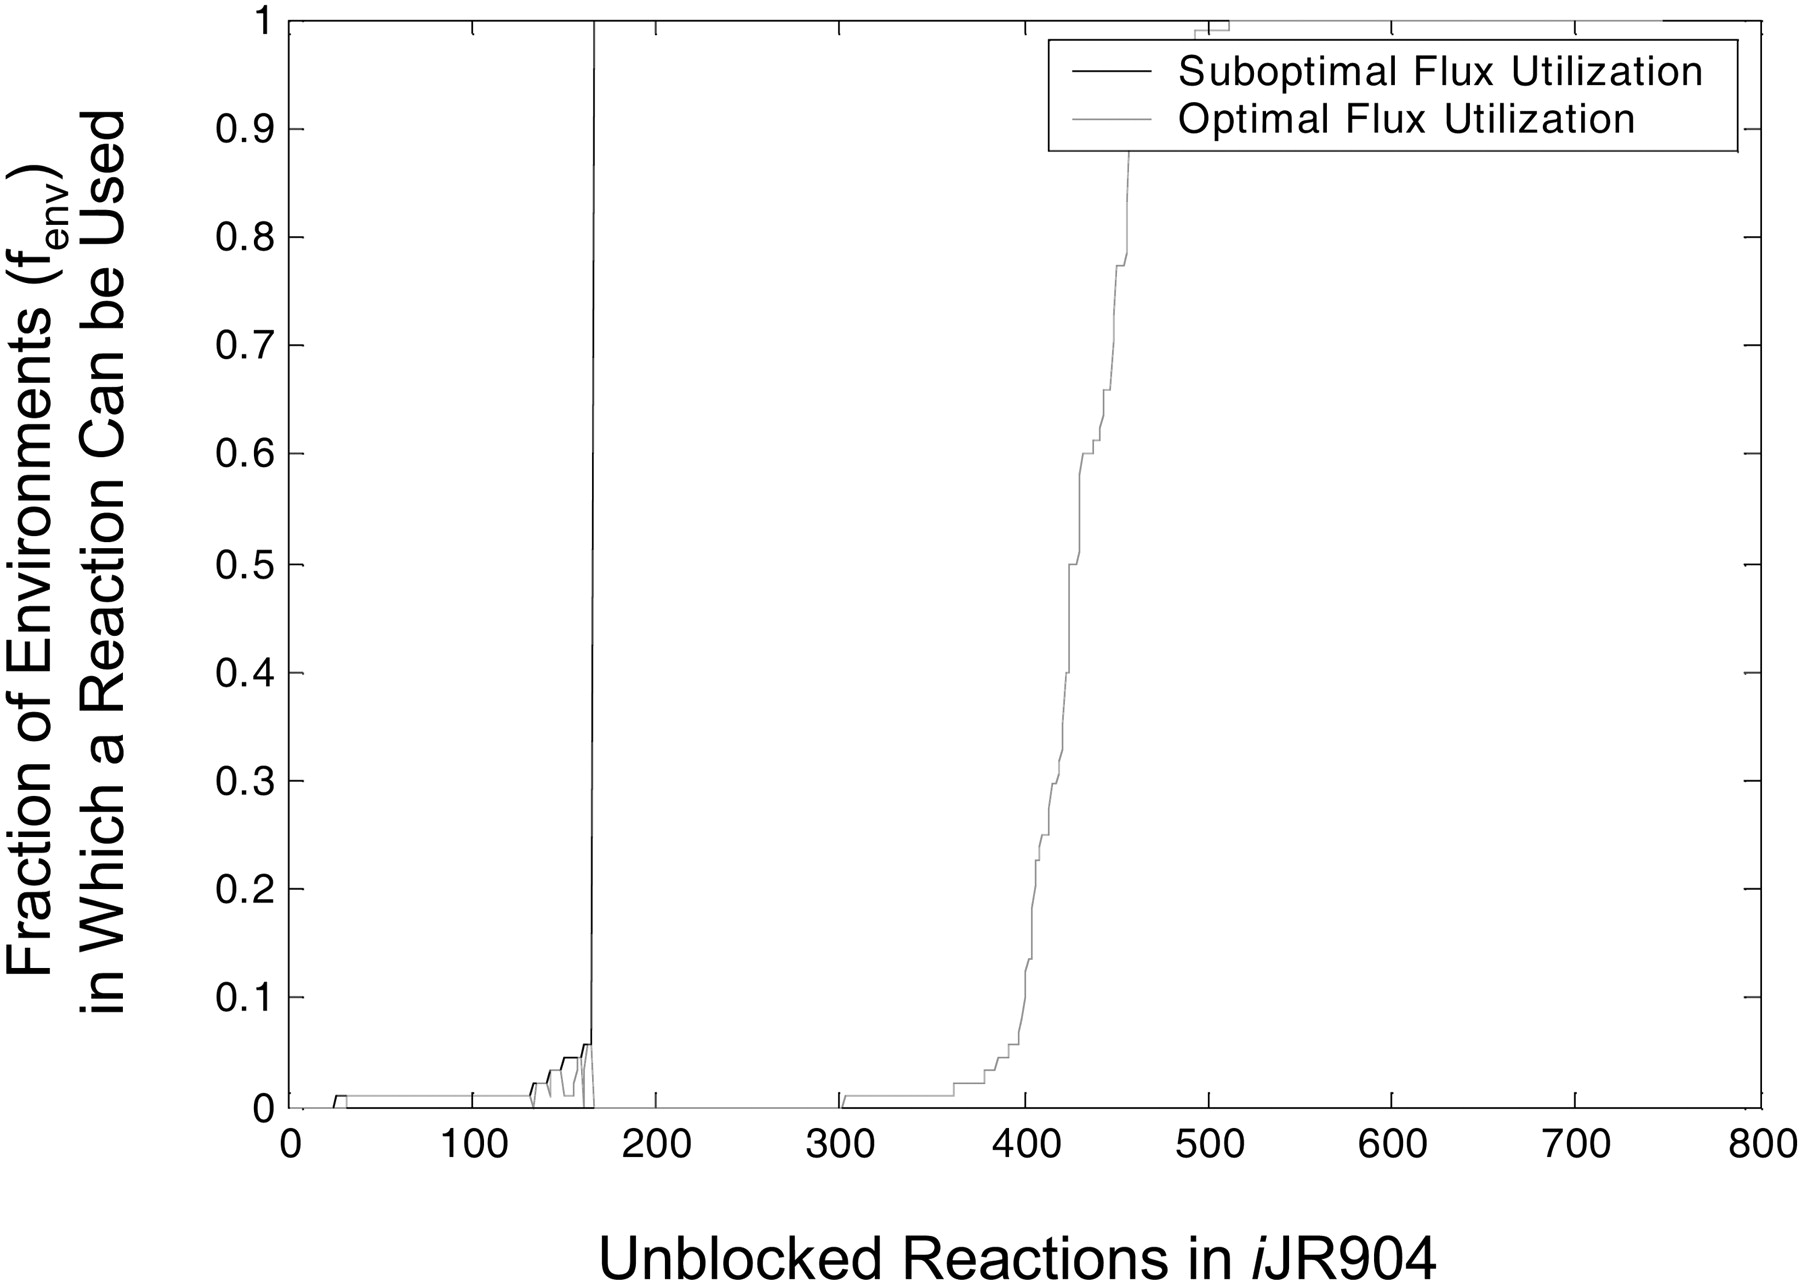
Figure 6
Reaction usage in optimal and suboptimal flux distributions. For each of the tested 88 aerobic environmental conditions, reactions were classified as being used in optimal solutions or used only in suboptimal solutions. The black line in the figure shows for each reaction the fraction of environments (fenv) that can use this reaction suboptimally. The gray line in the figure shows for each reaction the fraction of environments that can use this reaction in optimal solutions. The 185 blocked reactions in the network are not shown in the figure.


