
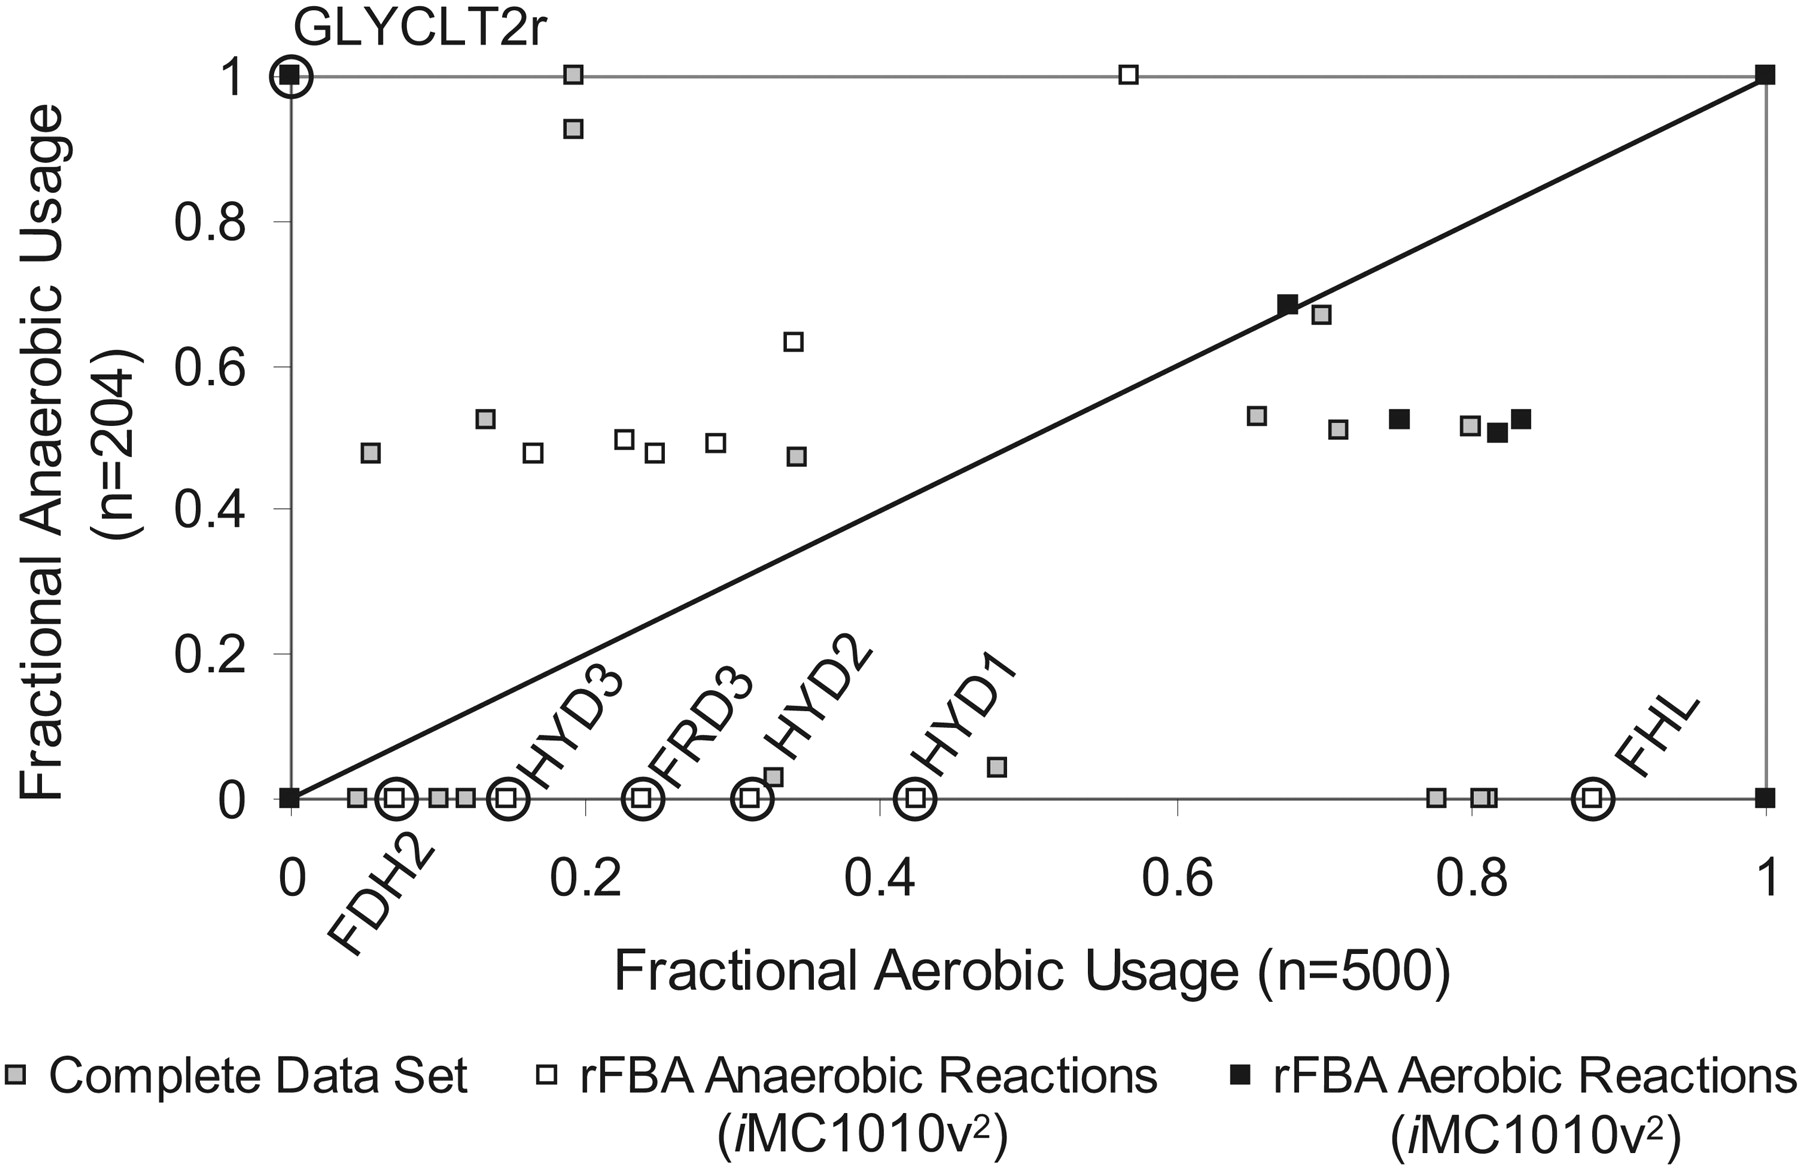
Preferential usage of fluxes under aerobic glucose vs. anaerobic glucose optimal growth. Each point in the graph represents one of the 931 metabolic reactions; the x-axis plots the fraction of optimal solutions that utilize that reaction under glucose aerobic conditions (500 optima), and the y-axis plots the fraction of optimal solutions that utilize that reaction under glucose anaerobic conditions (204 optima). Using a regulatory model (iMC1010v2) that accounts for known regulation and hypothesized regulation based on expression data, some reactions were predicted to have more isozymes present aerobically (black) or more isozymes present anaerobically (white). Discrepancies between regulation and usage of fluxes in alternate optima are circled and labeled in the figure, see text for further details.


