
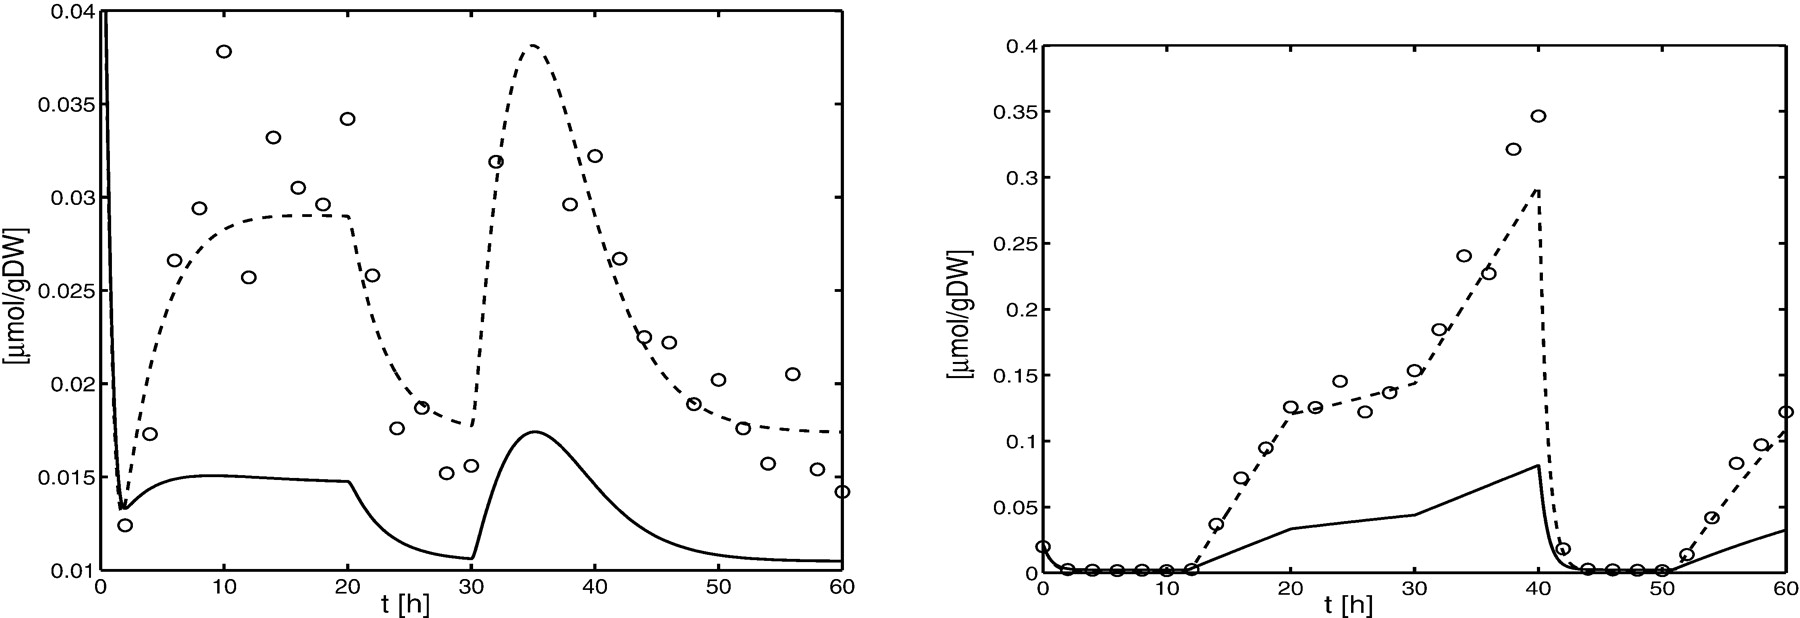
Figure 9
(Left) Enzyme concentration in benchmark experiment after fitting with the benchmark experiment and designed experiment for case 1. (Right) Enzyme concentration in the designed experiment (case 23) after fitting with the benchmark experiment and the designed experiment for case 23. In silico measurement results (circles) and results obtained with Model A (solid line) and Model B (dashed line). Results of Model A do not fit.


