
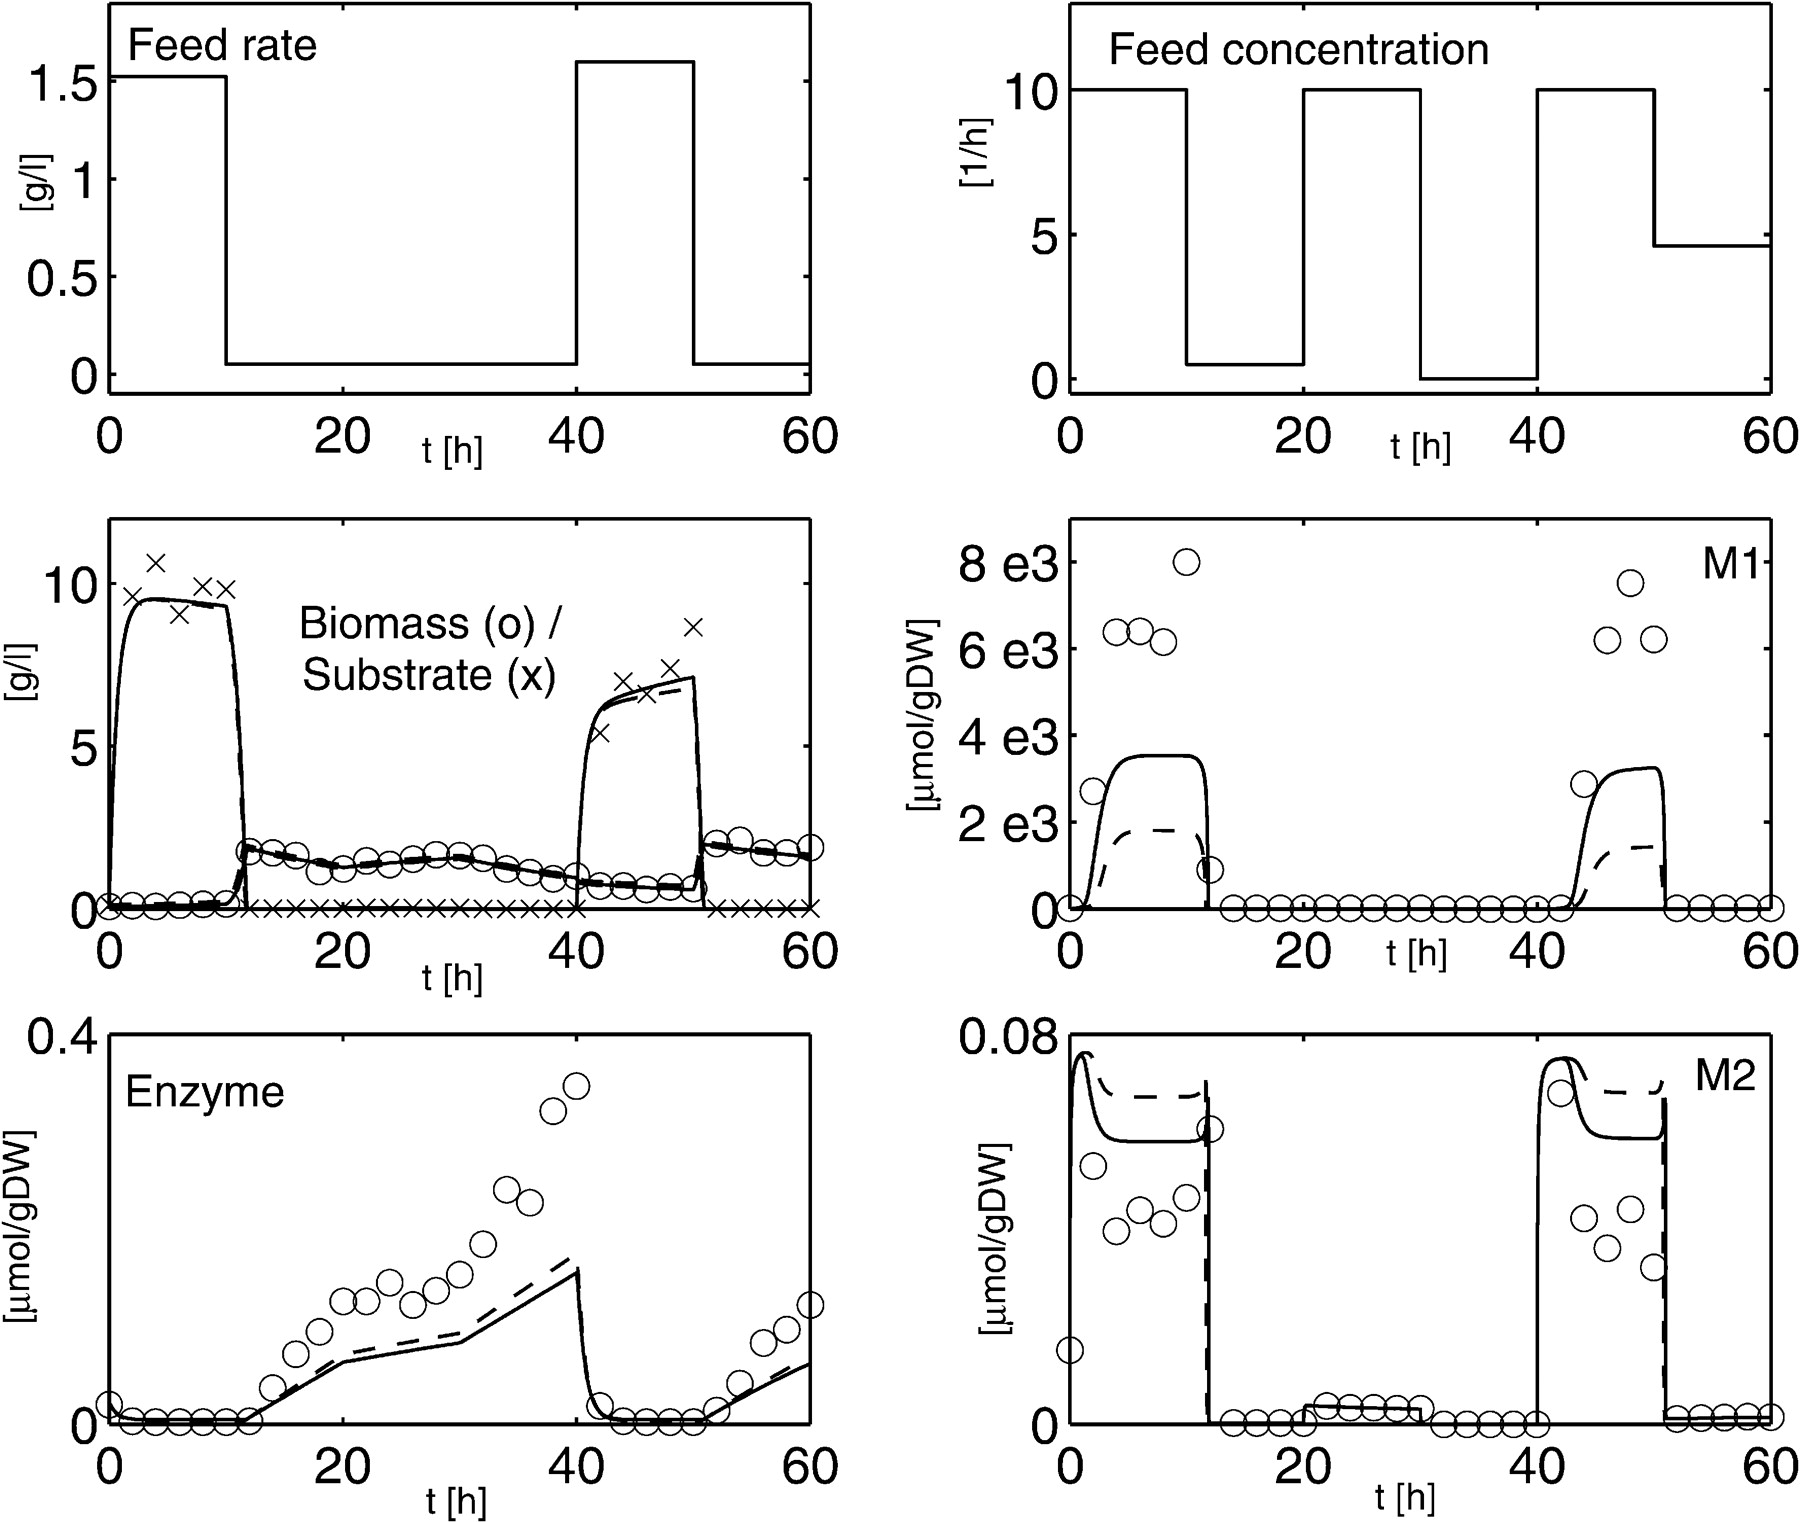
Figure 8
Optimal experiment, designed with W as in equation 29 (case 23). Optimal input profiles, in silico measurement results (circles), and results obtained with Model A (solid line) and Model B (dashed line) with the initial sets of parameters. Differences between the results of the two models are most notable in M1.


