
Figure 7
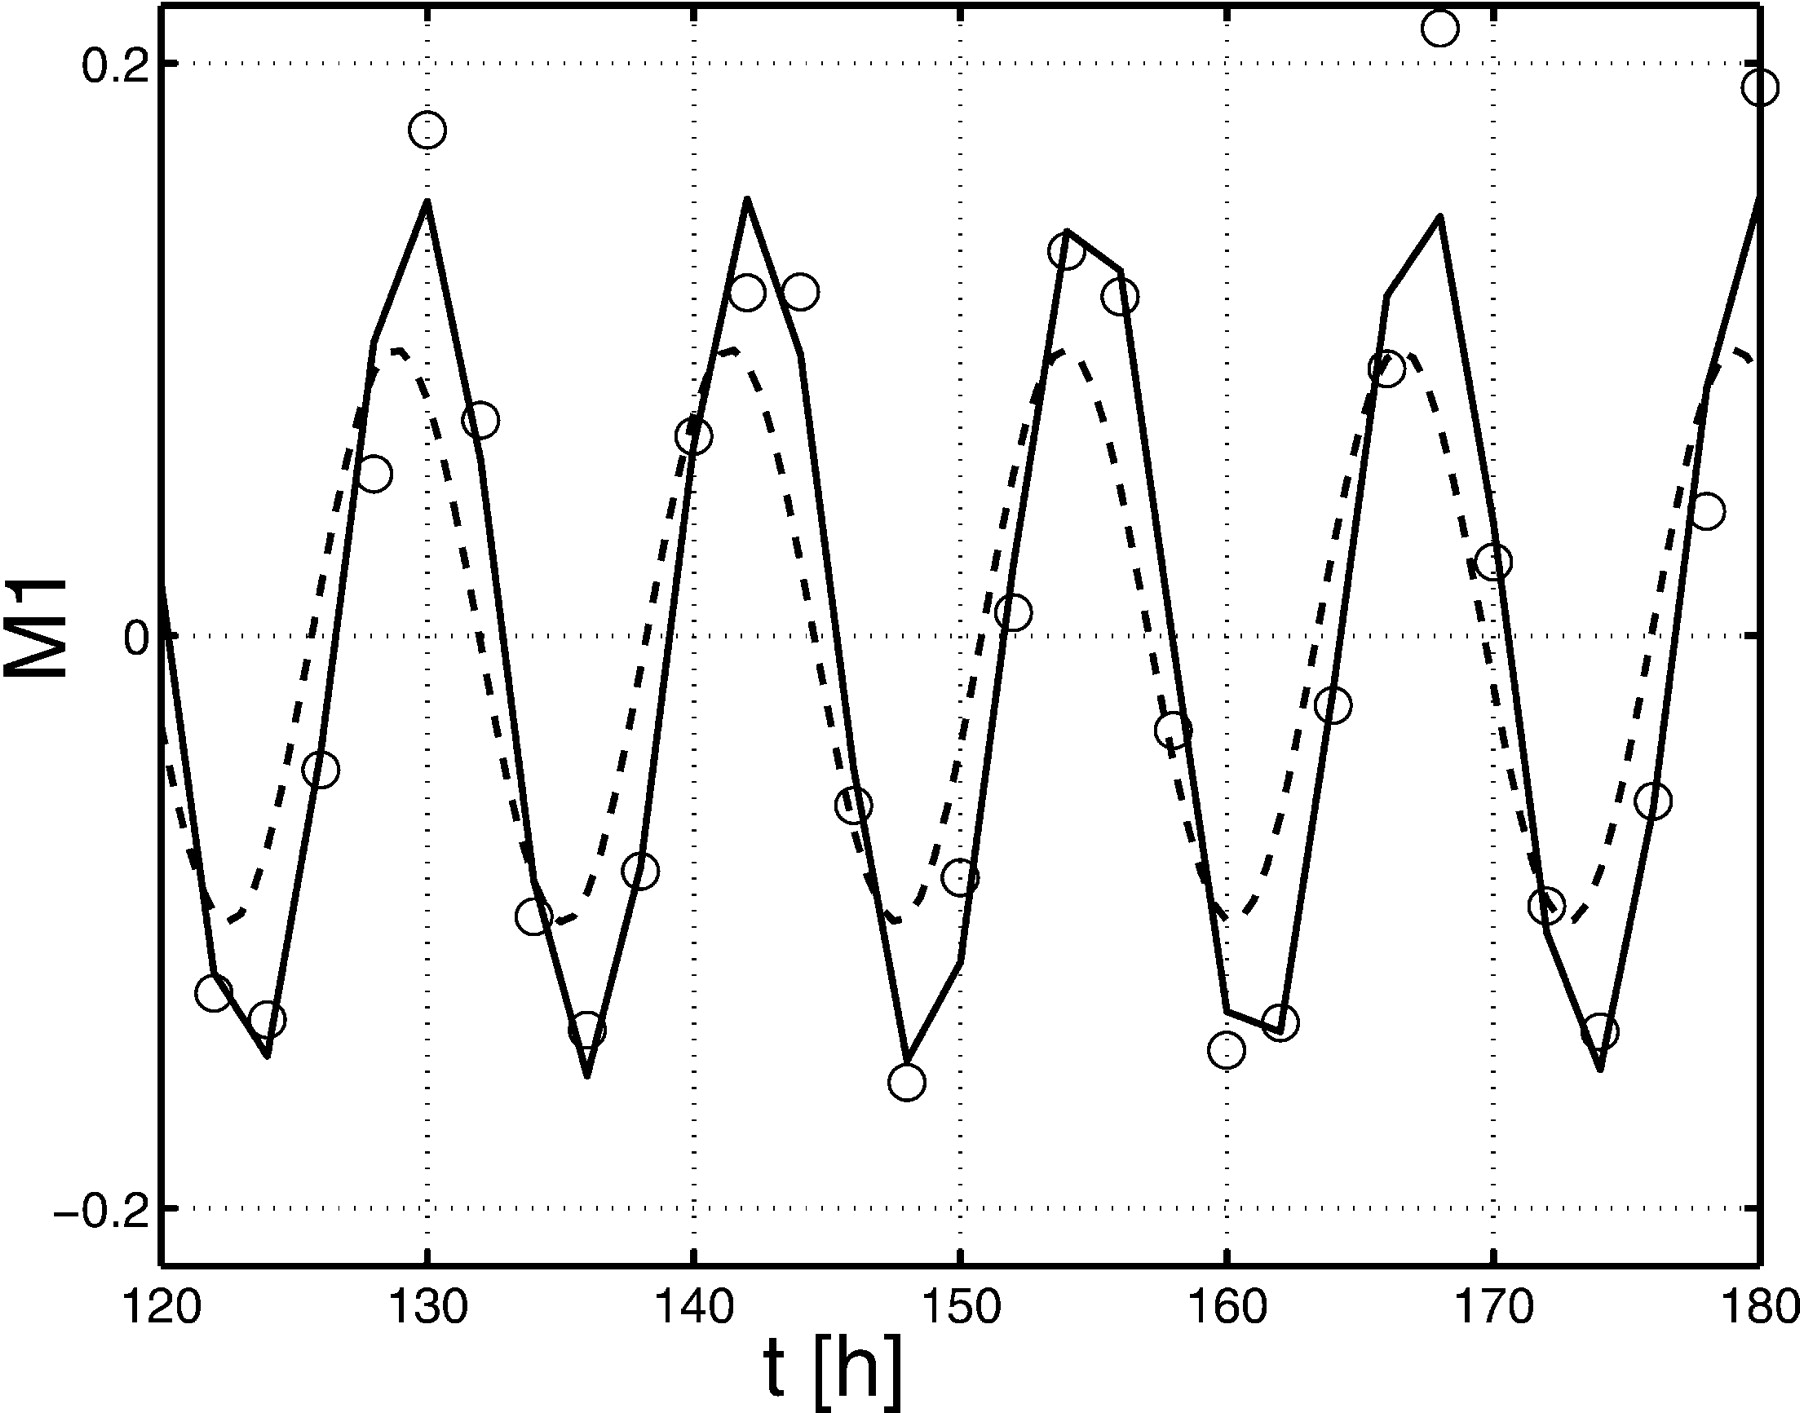
Time course of qin (dashed), fitted (solid), and experimental values (circles) for M1; values are plotted minus mean values.
(Downloading may take up to 30 seconds. If the slide opens in your browser, select File -> Save As to save it.)
Click on image to view larger version.
Time course of qin (dashed), fitted (solid), and experimental values (circles) for M1; values are plotted minus mean values.
 CiteULike
 Delicious
 Digg
Digg Facebook
 Google+
 Reddit
 Twitter
