
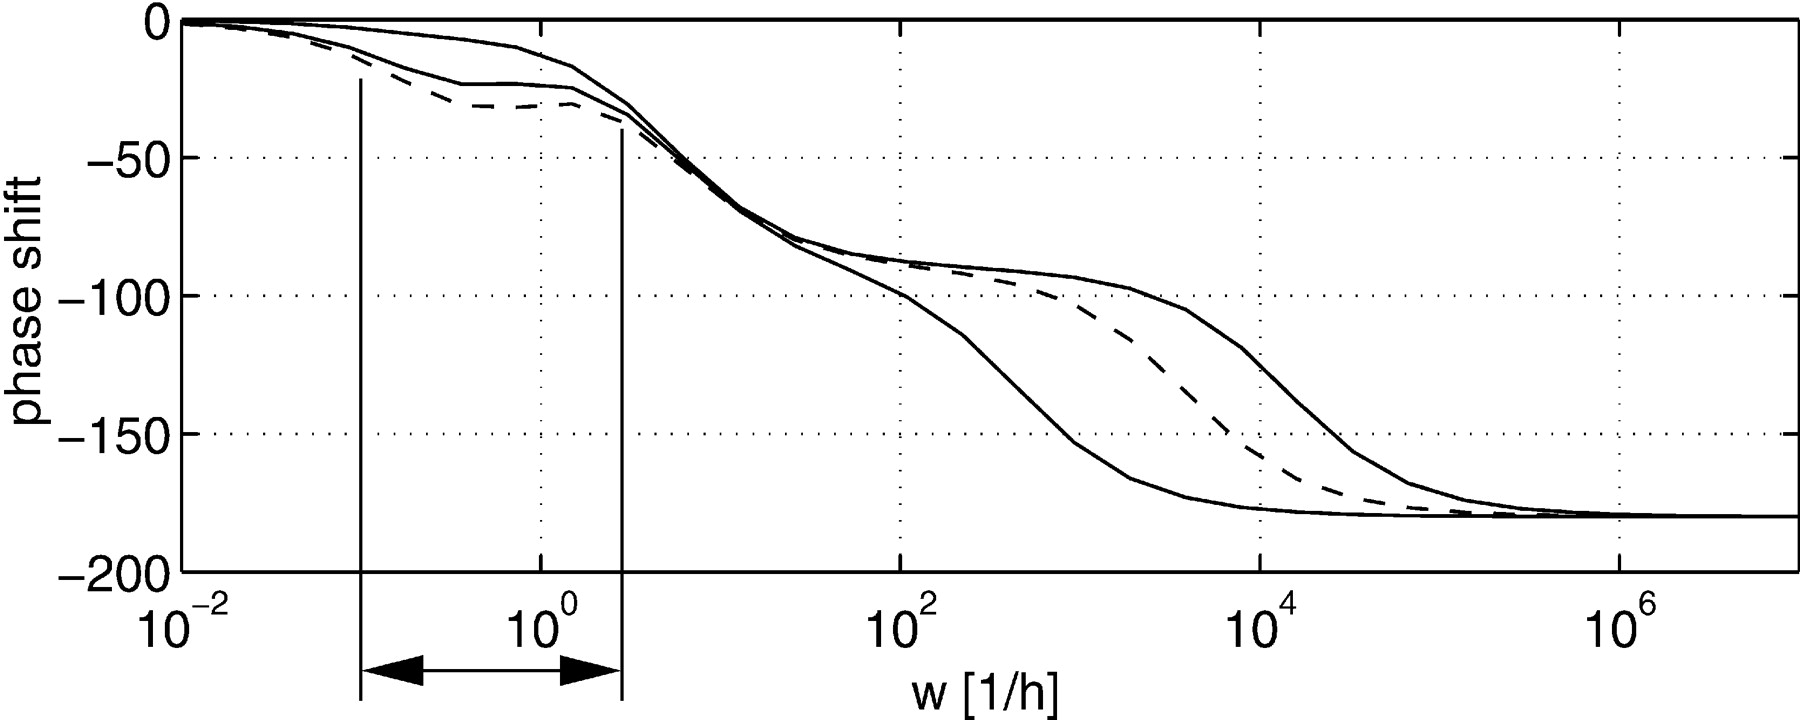
Figure 6
Phase shift for input q on output cM1. Solid lines show maximal and minimal values for Model A, whereas dashed lines show minimal and maximal values for Model B varying parameters KIA and KIB between 5 × 10⁻³ and 10. For the small frequency span indicated by the vertical lines, the models are clearly separated (because of very small distances between the dashed lines, only one line can be seen).


