
Figure 5
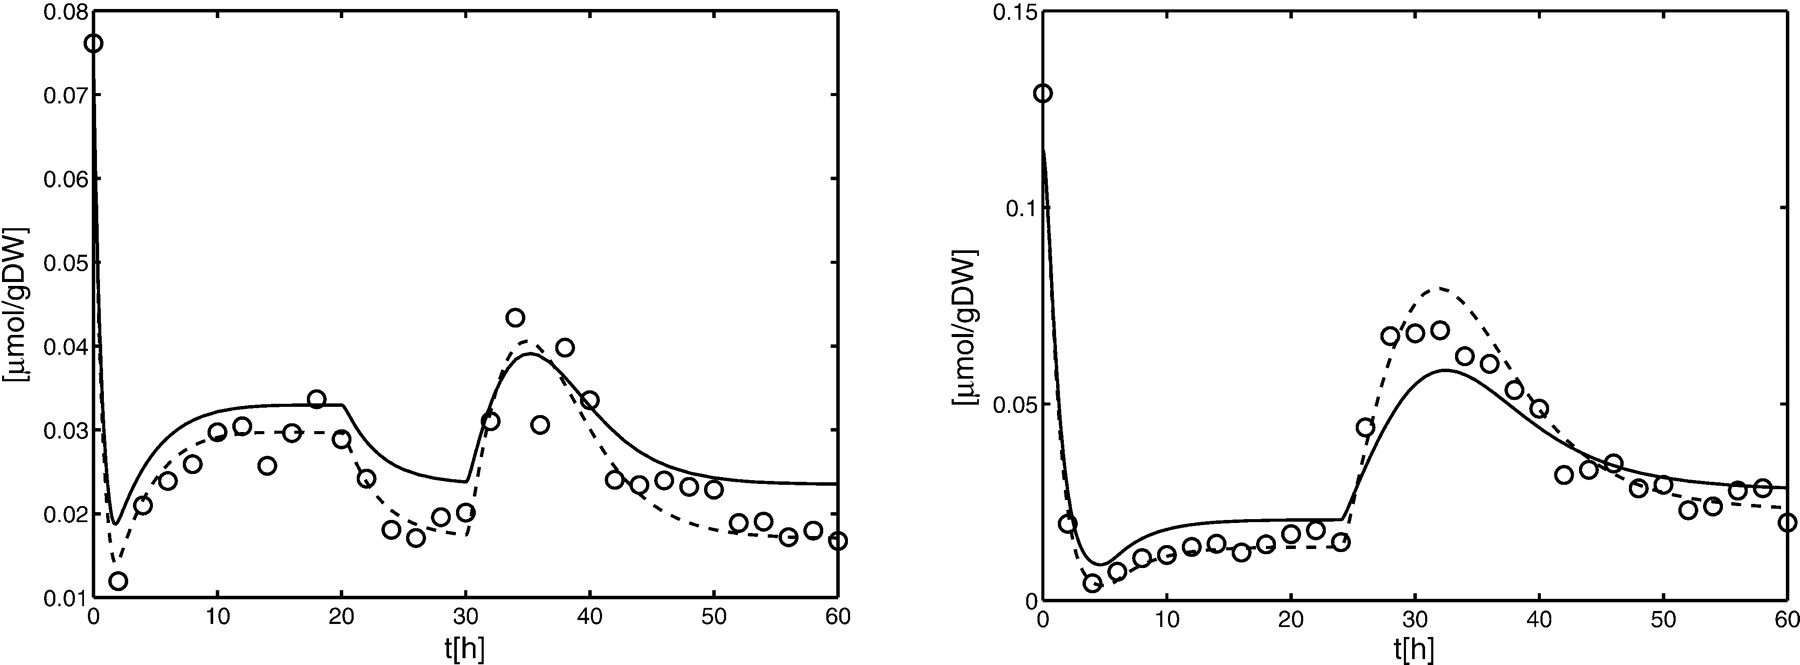
Data points of metabolite M3 (○) versus simulated time courses of Model A (solid) and Model B for the benchmark experiment (left) and the new experiment (right).
(Downloading may take up to 30 seconds. If the slide opens in your browser, select File -> Save As to save it.)
Click on image to view larger version.
Data points of metabolite M3 (○) versus simulated time courses of Model A (solid) and Model B for the benchmark experiment (left) and the new experiment (right).
 CiteULike
 Delicious
 Digg
Digg Facebook
 Google+
 Reddit
 Twitter
