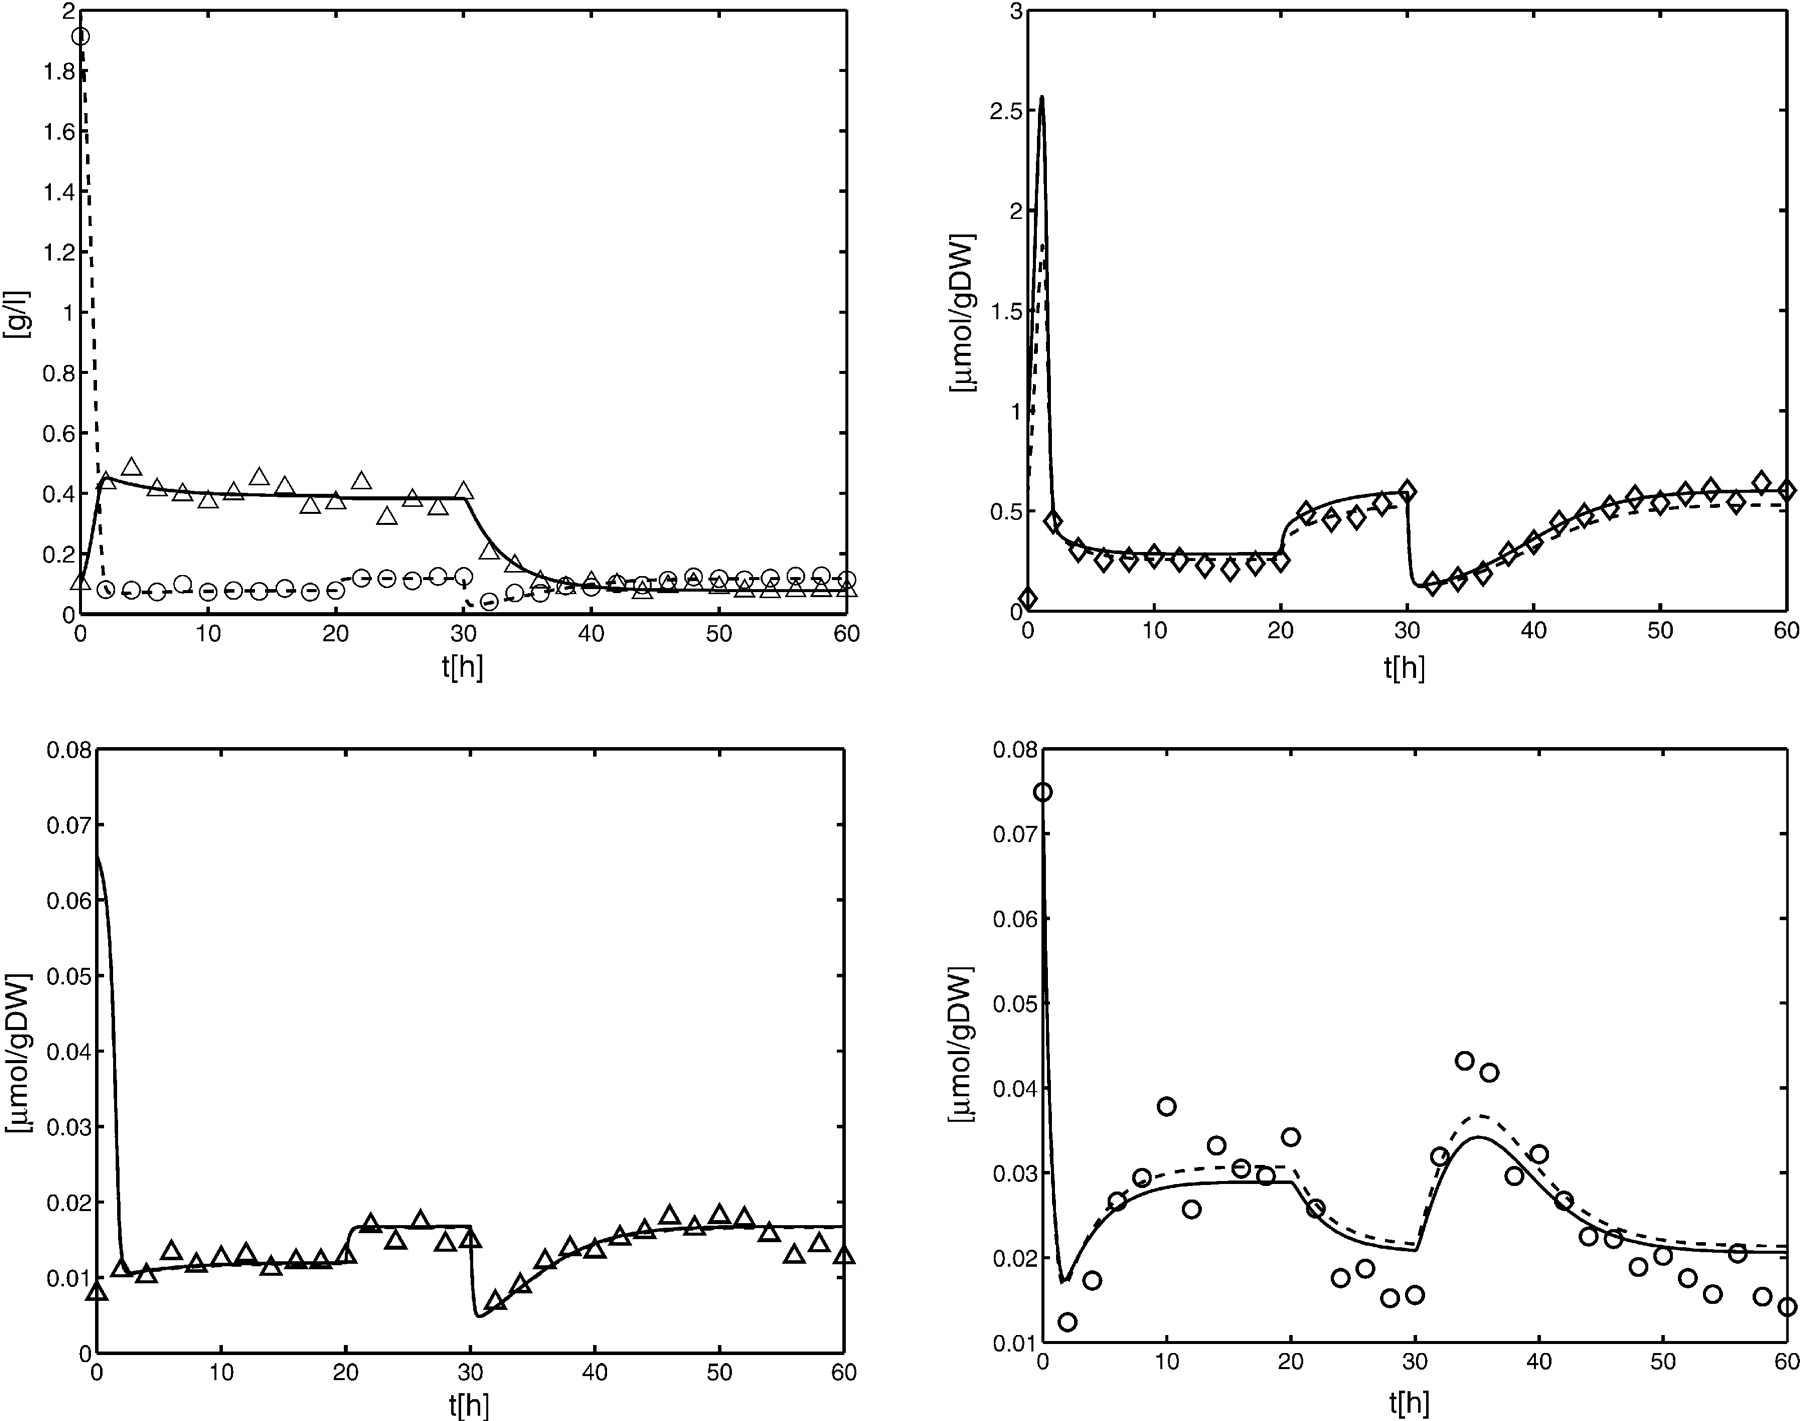
A Benchmark for Methods in Reverse Engineering and Model Discrimination: Problem Formulation and Solutions

(Downloading may take up to 30 seconds. If the slide opens in your browser, select File -> Save As to save it.)

Click on image to view larger version.

Figure 4
Figure 4

Benchmark data points (▵, ○) versus the simulated time courses of Model A (solid) and Model B (dashed) using the parameters of Table 3. Upper left: X solid, S dashed; upper right: M1; lower left: M2; lower right: M3.

This Article

  1. Genome Res. 14: 1773-1785

Preprint Server