
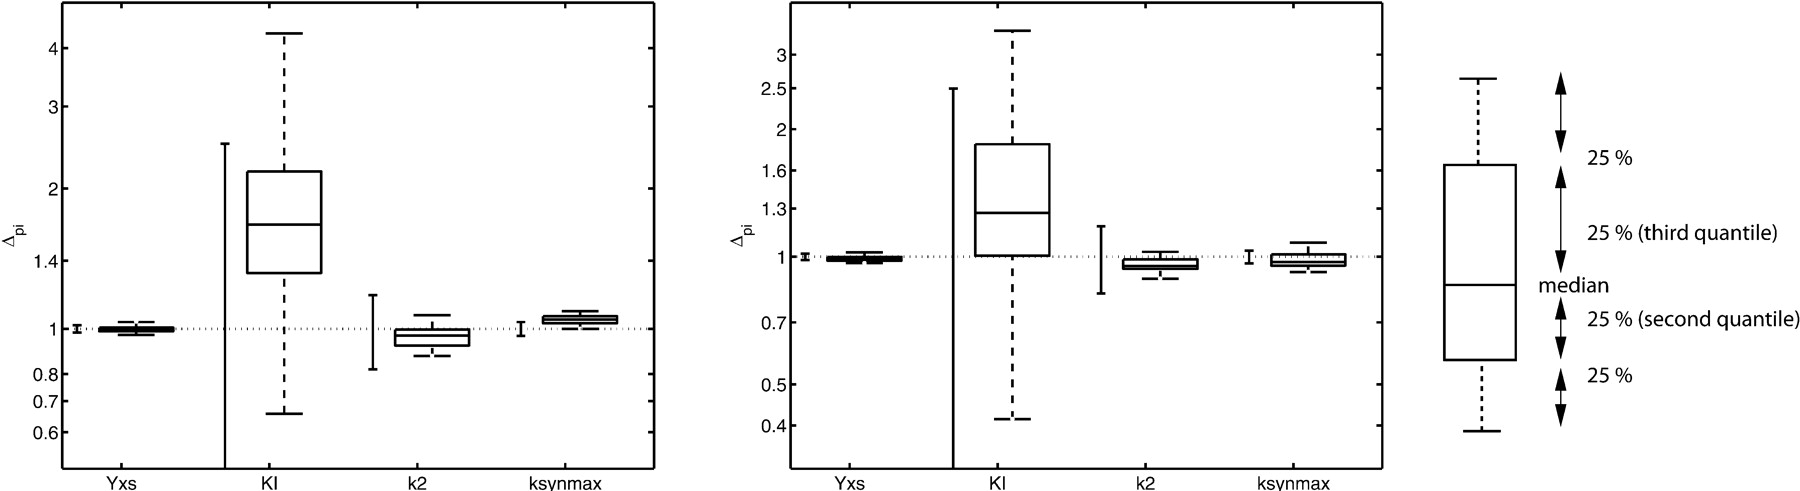
Figure 3
Parameter confidence intervals and box-plot. The parameter confidence intervals are shown normalized to the optimal values attained for the benchmark measurements. The 95% confidence interval based on the Fisher-Information-Matrix is depicted by the solid lines. The box-plot depicts the results of the bootstrap method. For both models, the estimated 95% interval for KI includes negative values. Therefore, the whole interval is not depicted here.


